wd. Range BB
This tool for MetaTrader 5 is specifically engineered to streamline your trading operations. This technical indicator acts as a specialized analysis tool designed to visualize market data. It helps traders identify emerging trends, momentum shifts, and key support or resistance levels by plotting statistical calculations directly onto price charts.
How to Setup and Use wd. Range BB
1. Installation: Place your file in the MQL/Indicators folder via "Open Data Folder" and restart your terminal.
2. Loading: Find the indicator in the Navigator, drag it onto your chart, and configure the input parameters in the popup window.
3. Customization: Press Ctrl+I to open the indicator list, select your tool, and click "Properties" to change colors, levels, or visual styles.
4. Updating: Replace the old file in the Indicators folder with the new version and restart the platform to apply changes.
Frequently Asked Questions
Q: Why is my indicator not showing? A: Verify the file is in the MQL/Indicators folder, or try right-clicking the "Indicators" tree in the Navigator and clicking "Refresh."
Q: Do custom indicators slow down the platform? A: Too many complex indicators can impact performance; remove unused ones via the "Indicator List" (Ctrl+I).
Q: Can I use MT4 indicators on MT5? A: No, MQL4 and MQL5 are distinct languages; ensure the indicator is compiled specifically for your platform version.
Description & Settings
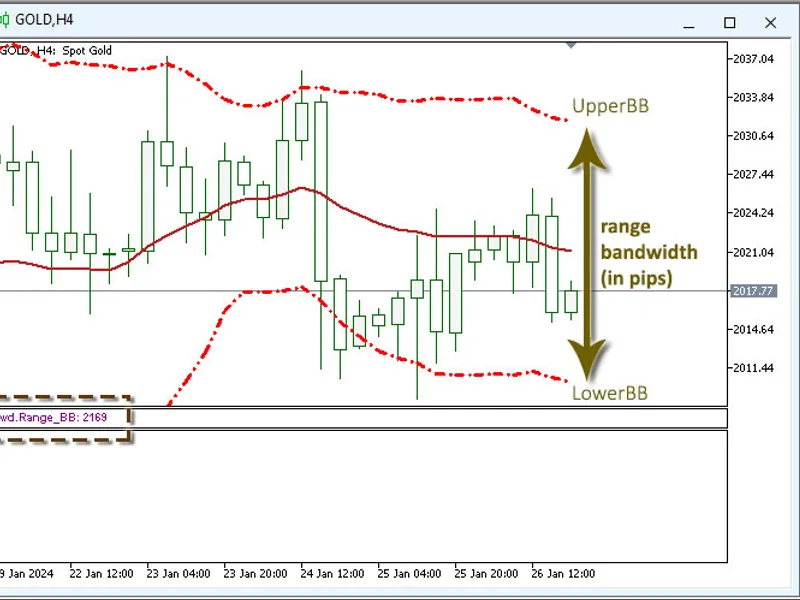
The MT5 custom indicator, named 'wd.Range_BB,' is designed to display Bollinger Bands with customized colors and line styles on the chart and calculate the range bandwidth. The range bandwidth is the difference in pips between the upper and lower Bollinger Bands.
Here's how the indicator works:
Bollinger Bands Settings:
These parameters allow users to customize the appearance and behavior of the Bollinger Bands. User can adjust the period, shift, deviation, and applied price for the Bollinger Bands, as well as the visual aspects such as color and line style.
Place the 'range/bandwidth information' label in the specified Sub-Window:
The Sub-Window input parameter specifies the sub-window number where the labels need to be placed.
UpperBB-LowerBB distance information can be placed in the main chart or sub-window. User can also adjust label distances (X and Y-Position).
To place labels in the main chart, simply input '0' in the 'Sub-Window placement' properties.
Overall, the 'wd.Range_BB' indicator displays the range bandwidth in a label, and the Bollinger Bands are plotted on the main chart. This indicator can help users visualize the flexibility and volatility of the market based on the width of the Bollinger Bands.