Convergent Divergent Range Volatility
This tool for MetaTrader 4 is specifically engineered to streamline your trading operations. This technical indicator acts as a specialized analysis tool designed to visualize market data. It helps traders identify emerging trends, momentum shifts, and key support or resistance levels by plotting statistical calculations directly onto price charts.
How to Setup and Use Convergent Divergent Range Volatility
1. Installation: Place your file in the MQL/Indicators folder via "Open Data Folder" and restart your terminal.
2. Loading: Find the indicator in the Navigator, drag it onto your chart, and configure the input parameters in the popup window.
3. Customization: Press Ctrl+I to open the indicator list, select your tool, and click "Properties" to change colors, levels, or visual styles.
4. Updating: Replace the old file in the Indicators folder with the new version and restart the platform to apply changes.
Frequently Asked Questions
Q: Why is my indicator not showing? A: Verify the file is in the MQL/Indicators folder, or try right-clicking the "Indicators" tree in the Navigator and clicking "Refresh."
Q: Do custom indicators slow down the platform? A: Too many complex indicators can impact performance; remove unused ones via the "Indicator List" (Ctrl+I).
Q: Can I use MT4 indicators on MT5? A: No, MQL4 and MQL5 are distinct languages; ensure the indicator is compiled specifically for your platform version.
Description & Settings
The CDRVolatility indicator can be used as a guide for setting the S/L, T/P and T/S. Within the chosen time window, for a net positive price gain, this indicator displays the largest upswing (convergent signal) and the largest downswing (divergent signal). For a net negative price change, the largest downswing becomes the convergent signal and the largest upswing is the divergent signal.
Trading performance improves as the convergent and divergent curves spread apart. The divergent signal provides a lower limit for the Stop Loss (in pips). The convergent signal provides a guide to the Take Profit level and the overall range volatility.
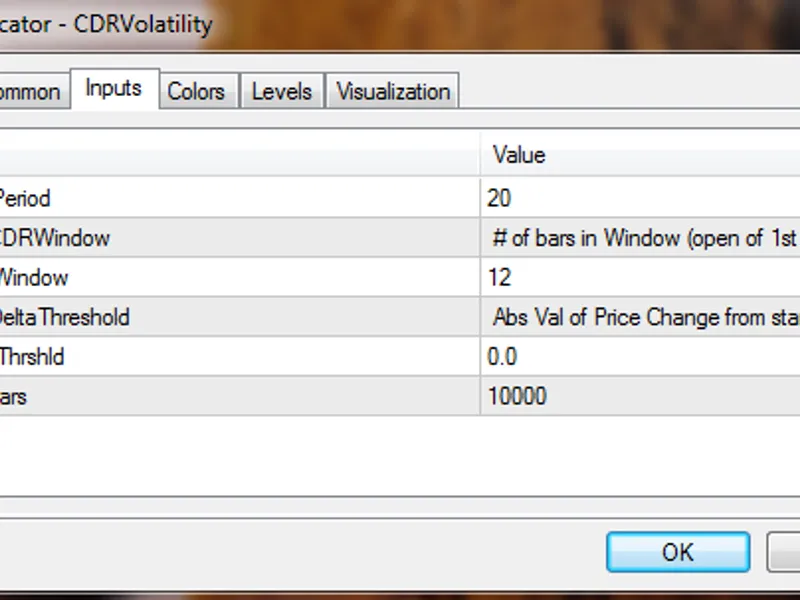
The user can choose the window size, the threshold (pips) for price movement (open to close across the window) and the period for averaging the indicator.
Input Parameters:
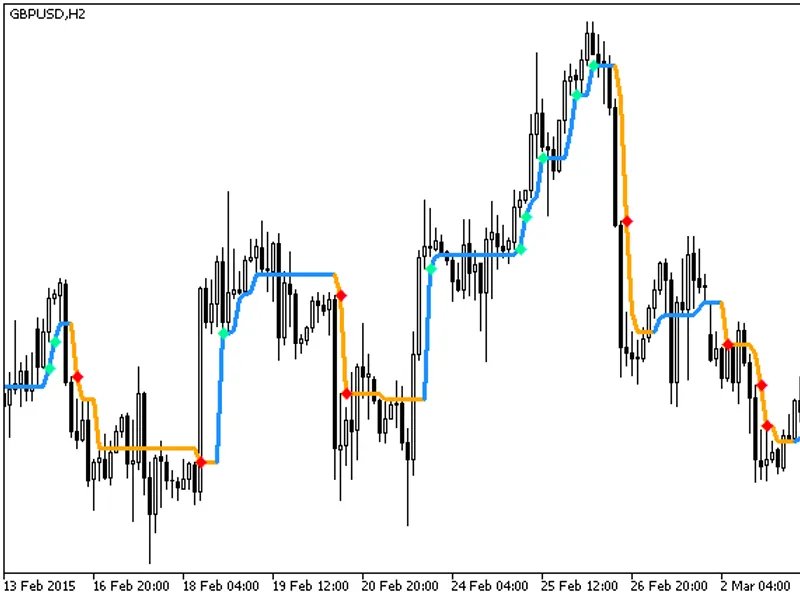
Fig.1. Convergent (Thick Line) and Divergent (Thin Line) Signals
Recommendations:
The price threshold should be set so that it is normally met across the selected window size for the selected timeframe. Suitable timeframes are H1, H4 and D1. For the H4 timeframe, a window size of 12 bars, a SMA period of 20 and a Delta Threshold of 20 or less works well.