RS I Improved
This software component for MetaTrader 5 is built to enhance the capabilities of your trading environment. This technical indicator acts as a specialized analysis tool designed to visualize market data. It helps traders identify emerging trends, momentum shifts, and key support or resistance levels by plotting statistical calculations directly onto price charts.
How to Setup and Use RS I Improved
1. Installation: Place your file in the MQL/Indicators folder via "Open Data Folder" and restart your terminal.
2. Loading: Find the indicator in the Navigator, drag it onto your chart, and configure the input parameters in the popup window.
3. Customization: Press Ctrl+I to open the indicator list, select your tool, and click "Properties" to change colors, levels, or visual styles.
4. Updating: Replace the old file in the Indicators folder with the new version and restart the platform to apply changes.
Frequently Asked Questions
Q: Why is my indicator not showing? A: Verify the file is in the MQL/Indicators folder, or try right-clicking the "Indicators" tree in the Navigator and clicking "Refresh."
Q: Do custom indicators slow down the platform? A: Too many complex indicators can impact performance; remove unused ones via the "Indicator List" (Ctrl+I).
Q: Can I use MT4 indicators on MT5? A: No, MQL4 and MQL5 are distinct languages; ensure the indicator is compiled specifically for your platform version.
Description & Settings
Fedor Igumnov
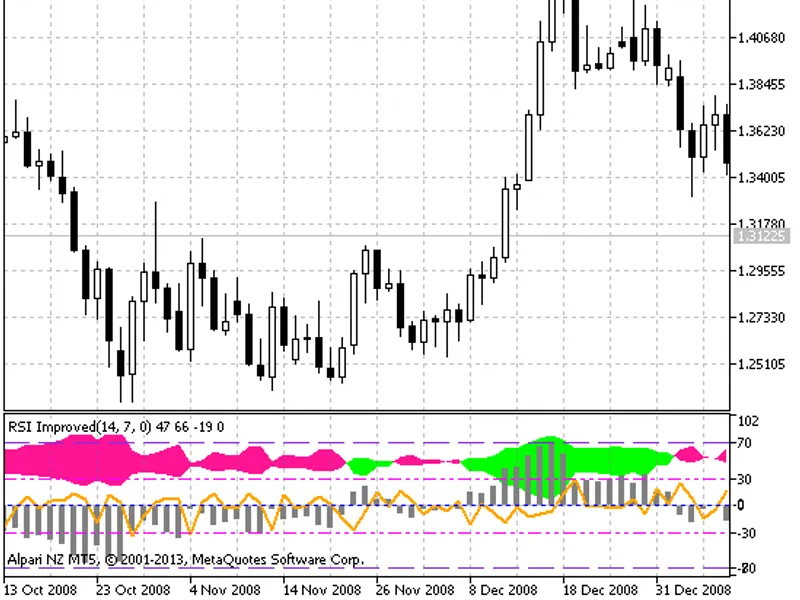
A combined indicator, built on the basis of two RSI oscillators.
This indicator calculates the value of the RSI indicator with the RSIPeriodOriginal period and the value of RSI with the RSIPeriodRotated period. Then it turns RSIPeriodRotated 180 degrees relative to the level of 50 points (100-RSI). Finds the difference between the original value of the first indicator and the inverted value of the second one. Then it calculates the derivative of this difference.
The colored cloud is formed from two RSI indicators.
A gray histogram is the difference between the original value and the inverted value.
An orange line is a derivative of the histogram (the rate of change of the difference between the original value and the inverted value).
Figure 1. The RSIImproved indicator