Download ALL MT5 indicators (5730)

Similar MetaTrader Tools










Rainbow Ranga - AKM Trading Tool
Info
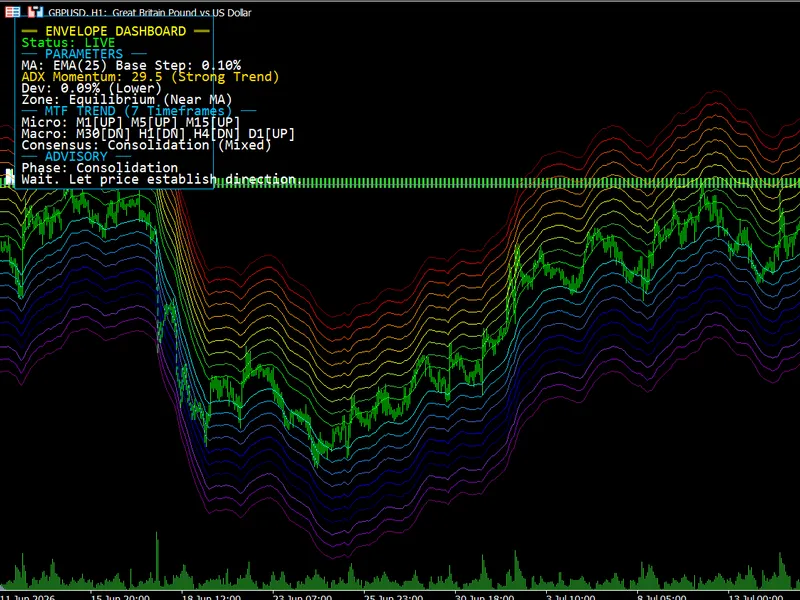
The Rainbow Ranga - AKM Trading Tool is a Indicator for MetaTrader 5 that this is a layman’s breakdown of how this tool works, what we built into it, and how you can use it for classical trading. Understanding the Core Concepts- The Rainbow (The Rubber Band Effect)Think of the hidden center line (the 25 EMA) as the market's home base or fair value.
Usage
This tool is typically used for enhancing chart analysis and decision making.
Platform
This Indicator works exclusively on MetaTrader 5 (both build 600+ and newer versions).
Setup
Place the downloaded file in MQL5/Indicators folder via File ? Open Data Folder in MetaTrader 5.
How to Install and Use Rainbow Ranga - AKM Trading Tool
1. Installation: Place your file in the MQL/Indicators folder via "Open Data Folder" and restart your terminal.
2. Loading: Find the indicator in the Navigator, drag it onto your chart, and configure the input parameters in the popup window.
3. Customization: Press Ctrl+I to open the indicator list, select your tool, and click "Properties" to change colors, levels, or visual styles.
4. Updating: Replace the old file in the Indicators folder with the new version and restart the platform to apply changes.
Frequently Asked Questions
Q: Why is my indicator not showing? A: Verify the file is in the MQL/Indicators folder, or try right-clicking the "Indicators" tree in the Navigator and clicking "Refresh."
Q: Do custom indicators slow down the platform? A: Too many complex indicators can impact performance; remove unused ones via the "Indicator List" (Ctrl+I).
Q: Can I use MT4 indicators on MT5? A: No, MQL4 and MQL5 are distinct languages; ensure the indicator is compiled specifically for your platform version.
What this tool does
This is a layman’s breakdown of how this tool works, what we built into it, and how you can use it for classical trading.
Typical Use Case
This Indicator excels in automated trading and technical analysis on MetaTrader 5.
Compatible Platform & Setup
This Indicator works on MetaTrader 5. Place the file in the MQL5/Indicators folder and restart the terminal.
Description & Settings
Related: rainbow - another powerful indicator for MetaTrader 5 traders.
This is a layman’s breakdown of how this tool works, what we built into it, and how you can use it for classical trading.Understanding the Core Concepts
Also recommended: rainbow ht f - similar indicator with strong performance on MetaTrader 5.
- The Rainbow (The Rubber Band Effect)
Think of the hidden center line (the 25 EMA) as the market's home base or fair value. The colored bands (envelopes) act like a rubber band.
When price is near the middle, there is no tension.
When price pushes up into the Red / Orange zones, the rubber band is stretched tightly upward. The asset is considered expensive or overbought.
When price drops into the Blue / Violet zones, the rubber band is stretched tightly downward. The asset is cheap or oversold.
Classical Rule: Rubber bands always want to snap back to their resting state.
- The 7-Timeframe Analysis (The Weather Forecast)
Looking at a 5-minute chart is like looking out the window to see a gust of wind, but looking at a Daily chart tells you the actual season. Our dashboard looks at 7 timeframes at once (from 1 Minute to Daily).
If the higher timeframes (Macro) are Bullish, the overall season is upward.
If the lower timeframes (Micro) suddenly drop, it's just a temporary breeze against the main trend.
- The ADX (The Train's Speedometer)
The ADX measures momentum. If the ADX is weak, the market is just drifting sideways. If the ADX is strong, a massive train is moving. You never want to stand in front of a speeding train by betting on a reversal just because price hit a red or violet line.
How to Trade with It (Classical Strategies)
Using the dashboard's advice, here are the three classical ways you would trade this setup:
- Strategy 1: The Buy the Dip (Trend Continuation)
This is the safest and most reliable classical strategy. You are looking to align the short-term pullback with the long-term trend.
What to look for: The dashboard says the MTF Consensus is STRONGLY BULLISH.
The Trigger: You wait patiently for the price to drop into the lower bands (Blue/Violet).
The Action: Because the macro trend is UP, this drop isn't a crash; it's a discount. The dashboard will flag this as a Corrective Pullback (Buy Zone). You buy the asset, expecting it to bounce off the violet bands and resume its upward journey.
- Strategy 2: The Rubber Band Snap (Mean Reversion)
You use this when the market is trapped in a sideways range and there is no clear long-term trend.
What to look for: The dashboard says the MTF Consensus is Mixed / Consolidation and the ADX is Weak.
The Trigger: Price spikes violently into the EXTREME RED or EXTREME VIOLET zones (0.8%+ deviation).
The Action: Because there is no strong trend to keep pushing the price further, the rubber band is maxed out. You trade against the spike (sell the red, buy the violet), expecting the price to snap back to the middle Moving Average.
- Strategy 3: Profit Taking (Impulse Exhaustion)
Sometimes the best trade is doing nothing, or simply taking your money off the table.
What to look for: You are already in a Buy trade. The MTF trend is Strongly Bullish, and price rallies hard into the Extreme Red zone.
The Action: The dashboard will read Impulse Exhaustion (Wait/Scale Out). It knows the trend is up, so it tells you not to short/sell. However, it also knows the rubber band is stretched to the max, meaning a temporary drop is imminent. This is your signal to close your existing buy trade and take your profits.
Summary of the Features We Implemented
- Dynamic Visual Heatmap: 20 beautifully color-coded support and resistance bands that breathe with the market's volatility, spaced at precise 0.1% increments.
- 7-Timeframe Sentiment Engine: A silent scanner that checks the 1M, 5M, 15M, 30M, 1H, 4H, and Daily charts simultaneously to determine if the true market momentum is Bullish or Bearish.
- Smart Phase Detection: Logic that distinguishes between a dangerous market crash and a safe buy-the-dip opportunity based on trend alignment.
- Live Advisory UI: A sleek, fully customizable, floating dashboard that constantly translates the complex math into simple English instructions (e.g., ACTION: High Prob Buy).
You may also like: rainbow hm a - excellent alternative for indicator users on MetaTrader 5.
Source Code
#property copyright "RobotFX"
#property link "https://robotfx.org"
#property version   "1.02"
#property indicator_chart_window
#property indicator_buffers 21
#property indicator_plots 20
input string   _hdr1_ = "--- Envelope Settings ---";
input int      InpMAPeriod = 25;
input ENUM_MA_METHOD InpMAMethod = MODE_EMA;
input ENUM_APPLIED_PRICE InpAppliedPrice = PRICE_CLOSE;
.......
⚠ Limitations & Risk Warning
- This tool is provided for educational and testing purposes only.
- Past performance does not guarantee future results.
- Trading involves substantial risk of loss. Use on a demo account first.
- Results may vary depending on market conditions, broker, and settings.
- We recommend thorough backtesting and forward testing before using with real funds.