






Previous Day High, Low, and Close Levels Indicator
Info
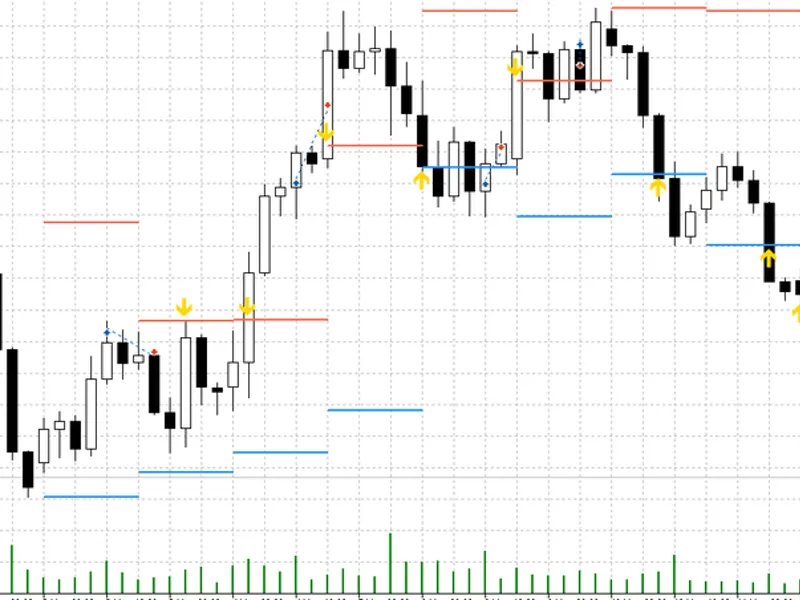
The Previous Day High, Low, and Close Levels Indicator is a Indicator for MetaTrader 5 that previous day high, low, and close levelsthe idea behind itmany traders use the previous day's high, low, and close prices as important reference points. The High and Low represent the price extremes of the prior trading session, indicating areas where price was either accepted or rejected.
Usage
This tool is typically used for enhancing chart analysis and decision making.
Platform
This Indicator works exclusively on MetaTrader 5 (both build 600+ and newer versions).
Setup
Place the downloaded file in MQL5/Indicators folder via File ? Open Data Folder in MetaTrader 5.
How to Install and Use Previous Day High, Low, and Close Levels Indicator
1. Installation: Place your file in the MQL/Indicators folder via "Open Data Folder" and restart your terminal.
2. Loading: Find the indicator in the Navigator, drag it onto your chart, and configure the input parameters in the popup window.
3. Customization: Press Ctrl+I to open the indicator list, select your tool, and click "Properties" to change colors, levels, or visual styles.
4. Updating: Replace the old file in the Indicators folder with the new version and restart the platform to apply changes.
Frequently Asked Questions
Q: Why is my indicator not showing? A: Verify the file is in the MQL/Indicators folder, or try right-clicking the "Indicators" tree in the Navigator and clicking "Refresh."
Q: Do custom indicators slow down the platform? A: Too many complex indicators can impact performance; remove unused ones via the "Indicator List" (Ctrl+I).
Q: Can I use MT4 indicators on MT5? A: No, MQL4 and MQL5 are distinct languages; ensure the indicator is compiled specifically for your platform version.
What this tool does
Previous Day High, Low, and Close LevelsThe Idea Behind ItMany traders use the previous day's High, Low, and Close prices as important reference points.
Typical Use Case
This Indicator excels in automated trading and technical analysis on MetaTrader 5.
Compatible Platform & Setup
This Indicator works on MetaTrader 5. Place the file in the MQL5/Indicators folder and restart the terminal.
Description & Settings
Related: Previous Day High/Low with First Touch Marker for MT4/MT5 - another powerful indicator for MetaTrader 5 traders.
Previous Day High, Low, and Close LevelsAlso recommended: Previous Day and Week Levels with Round Numbers - similar indicator with strong performance on MetaTrader 5.
The Idea Behind It
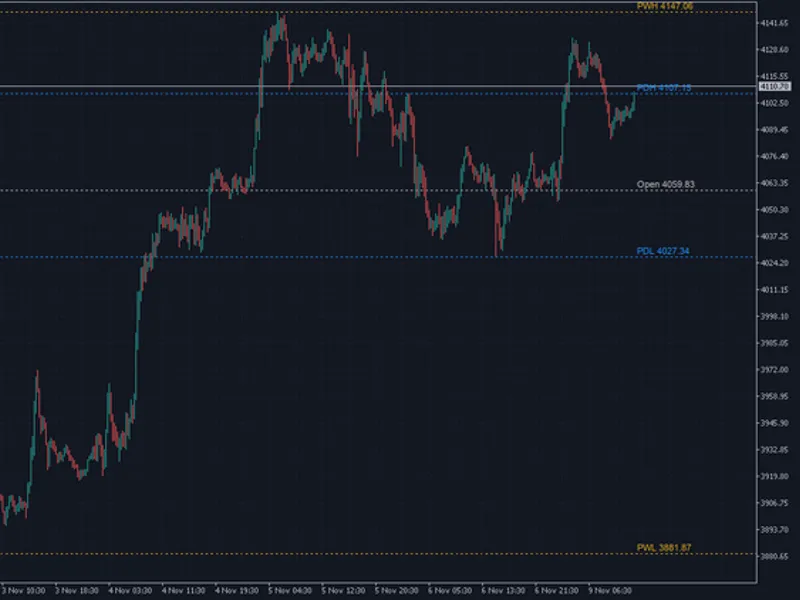
Many traders use the previous day's High, Low, and Close prices as important reference points. The High and Low represent the price extremes of the prior trading session, indicating areas where price was either accepted or rejected. The Close price signifies where the market settled. Today's trading activity often shows reactions around these levels, making them valuable for identifying potential breakouts, reversals, and price targets.
This indicator analyzes the daily bars of the selected symbol and automatically draws these significant levels on your chart. It operates using chart objects rather than indicator buffers, ensuring it is highly efficient and consumes minimal system resources. The levels are recalculated only when a new daily bar forms, not on every tick.
How to Interpret the Levels
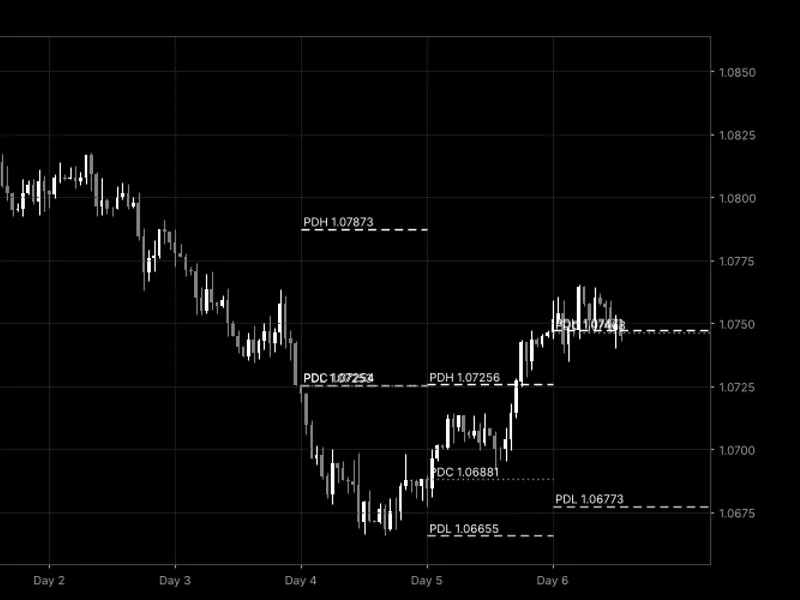
PDH (Previous Day High)
- This level is displayed as a dashed line at the highest price reached on the previous trading day. It can serve as a potential resistance level or an indicator of a significant breakout.
PDL (Previous Day Low)
- This level is shown as a dashed line at the lowest price reached on the previous trading day. It can act as a potential support level or signal a breakdown.
PDC (Previous Day Close)
- This level is represented by a dotted line at the closing price of the previous trading day. It often acts as a reference for fair value and can be a magnet for intraday price action.
Today's Levels
are plotted starting from the beginning of the current day and can be extended to the right.
Historical Levels
(when the InpDaysBack input is set to a value greater than 1) are drawn as shorter segments. Each segment corresponds to the specific day it was active, allowing you to observe historical price reactions to these levels.
Labels
are used to display the name of each level (e.g., PDH, PDL, PDC) along with its corresponding price value at the left end of each line.
External Variables (Inputs)
Input Name
Default Value
Purpose
Levels
InpShowHigh
true
Determines whether to display the Previous Day High level.
InpShowLow
true
Determines whether to display the Previous Day Low level.
InpShowClose
true
Determines whether to display the Previous Day Close level.
InpDaysBack
3
Sets the number of past days for which levels will be drawn (range from 1 to 100). A value of 1 will only draw levels for the current day.
InpExtendRight
true
Extends today's levels to the right of the last bar on the chart.
Lines
InpHighColor
clrWhite
Sets the color for the Previous Day High line.
InpLowColor
clrSilver
Sets the color for the Previous Day Low line.
InpCloseColor
clrGray
Sets the color for the Previous Day Close line.
InpLineStyle
STYLE_DASH
Defines the line style for the Previous Day High and Low levels.
InpCloseStyle
STYLE_DOT
Defines the line style for the Previous Day Close level.
InpLineWidth
1
Sets the width of the lines (range from 1 to 5).
Labels
InpShowLabels
true
Toggles the display of text labels showing the level names and prices.
InpLabelColor
clrWhite
Sets the color for the text labels.
InpLabelSize
8
Sets the font size for the text labels.
Recommended Usage
This indicator is best suited for intraday timeframes, such as M1 through H4. While it functions on Daily (D1) and higher timeframes, the plotted historical segments will appear very short.
It is compatible with a wide range of symbols, including Forex, metals, indices, stocks, and cryptocurrency CFDs.
The definition of a 'day' is based on the server time of your broker. Consequently, brokers with different server time zones or session start times may display slightly different levels, which is considered normal behavior.
On Mondays, the indicator will reference the previous trading day (typically Friday) as the 'previous day' since it relies on the most recent available daily bar.
If the necessary daily historical data has not yet been loaded into your terminal, the indicator will automatically attempt to retry the calculation on the next incoming tick.
All chart objects created by this indicator are prefixed with 'PrevDayLvl_' and are automatically removed when the indicator is deleted from the chart. To avoid conflicts, do not attach multiple instances of this indicator to the same chart, as they would attempt to use identical object names.
This indicator is suitable for both netting and hedging accounts because it does not perform any trading operations; it solely displays information on the chart.
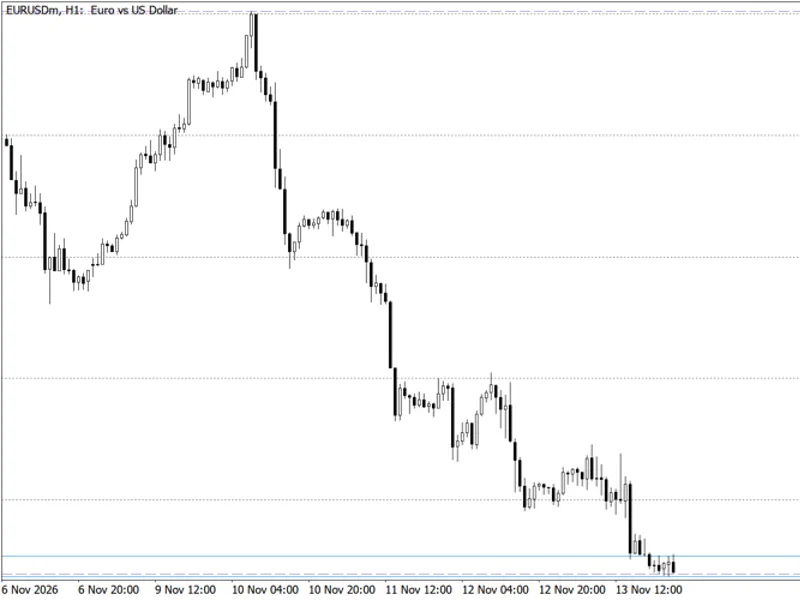
Figure 1 illustrates the PrevDayLevels indicator on an H1 chart with InpDaysBack set to 3. The image adheres to Code Base guidelines for black and white representation.
You may also like: Previous Day and Week High/Low Levels - excellent alternative for indicator users on MetaTrader 5.
Source Code
#property copyright "RobotFX"
#property link "https://robotfx.org"
#property version     "1.00"
#property description "This code is educational. Feel free to use, modify and upgrade as you wish. Visit ROBOTFX.ORG for professional trading tools"
#property indicator_chart_window
#property indicator_buffers 0
#property indicator_plots   0
input group "Levels"
input bool            InpShowHigh    = true;
input bool            InpShowLow     = true;
.......
⚠ Limitations & Risk Warning
- This tool is provided for educational and testing purposes only.
- Past performance does not guarantee future results.
- Trading involves substantial risk of loss. Use on a demo account first.
- Results may vary depending on market conditions, broker, and settings.
- We recommend thorough backtesting and forward testing before using with real funds.