Pivot point
This tool for MetaTrader 5 is specifically engineered to streamline your trading operations. This technical indicator acts as a specialized analysis tool designed to visualize market data. It helps traders identify emerging trends, momentum shifts, and key support or resistance levels by plotting statistical calculations directly onto price charts.
How to Setup and Use Pivot point
1. Installation: Place your file in the MQL/Indicators folder via "Open Data Folder" and restart your terminal.
2. Loading: Find the indicator in the Navigator, drag it onto your chart, and configure the input parameters in the popup window.
3. Customization: Press Ctrl+I to open the indicator list, select your tool, and click "Properties" to change colors, levels, or visual styles.
4. Updating: Replace the old file in the Indicators folder with the new version and restart the platform to apply changes.
Frequently Asked Questions
Q: Why is my indicator not showing? A: Verify the file is in the MQL/Indicators folder, or try right-clicking the "Indicators" tree in the Navigator and clicking "Refresh."
Q: Do custom indicators slow down the platform? A: Too many complex indicators can impact performance; remove unused ones via the "Indicator List" (Ctrl+I).
Q: Can I use MT4 indicators on MT5? A: No, MQL4 and MQL5 are distinct languages; ensure the indicator is compiled specifically for your platform version.
Description & Settings
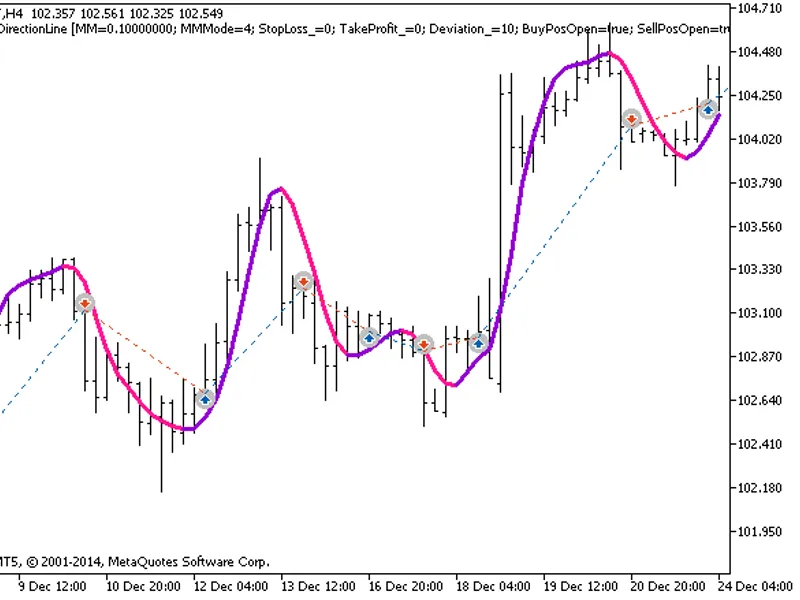
Pivot Point is a technical analysis indicator used in forex trading to identify potential price reversals. It is calculated based on the previous day's high, low, and close prices. Traders use Pivot Points to determine key support and resistance levels for the current trading day. These levels can help traders make informed decisions on when to enter or exit trades, set stop-loss orders, and take profit targets. Pivot Points are particularly useful in volatile markets where price movements can be unpredictable. By understanding Pivot Points and how they can indicate potential market turning points, traders can improve their chances of making profitable trades in the forex market.
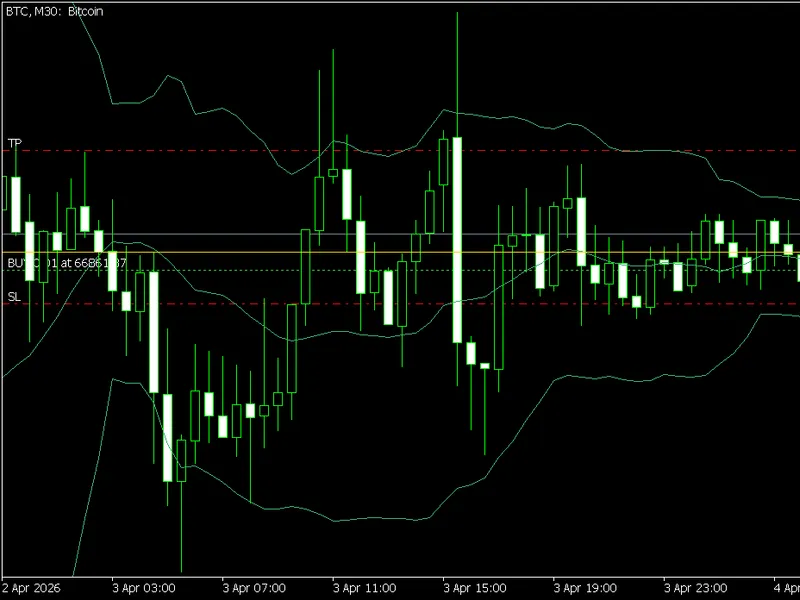
You can combine Pivot Point with any indicators like Moving Average and Bollinger Bands to enhance your trading strategy. By using multiple indicators together, you can gain a more comprehensive view of the market dynamics and make better-informed trading decisions. Pivot Points provide key support and resistance levels, while indicators like Moving Average and Bollinger Bands can help confirm trends and signal potential entry or exit points. Experimenting with different combinations of indicators can help you find the most effective approach for your trading style and risk tolerance.