PC A Synthetics - Recycle Legacy
This tool for MetaTrader 5 is specifically engineered to streamline your trading operations. This technical indicator acts as a specialized analysis tool designed to visualize market data. It helps traders identify emerging trends, momentum shifts, and key support or resistance levels by plotting statistical calculations directly onto price charts.
How to Setup and Use PC A Synthetics - Recycle Legacy
1. Installation: Place your file in the MQL/Indicators folder via "Open Data Folder" and restart your terminal.
2. Loading: Find the indicator in the Navigator, drag it onto your chart, and configure the input parameters in the popup window.
3. Customization: Press Ctrl+I to open the indicator list, select your tool, and click "Properties" to change colors, levels, or visual styles.
4. Updating: Replace the old file in the Indicators folder with the new version and restart the platform to apply changes.
Frequently Asked Questions
Q: Why is my indicator not showing? A: Verify the file is in the MQL/Indicators folder, or try right-clicking the "Indicators" tree in the Navigator and clicking "Refresh."
Q: Do custom indicators slow down the platform? A: Too many complex indicators can impact performance; remove unused ones via the "Indicator List" (Ctrl+I).
Q: Can I use MT4 indicators on MT5? A: No, MQL4 and MQL5 are distinct languages; ensure the indicator is compiled specifically for your platform version.
Description & Settings
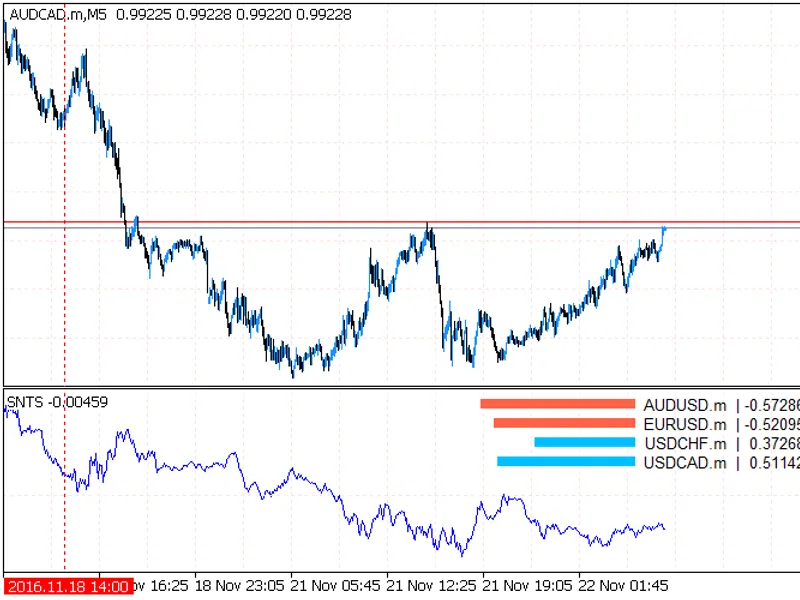
Indicator for automatic selection of the coefficients for every instrument in a pseudo-stationary portfolio, which tends to equilibrium at zero.
The indicator requires the presence of the AlgLib library in the Include\Math folder of the terminal.
A Bit of Theory
Every instrument moves in its own direction, every direction is a separate dimension in a multidimensional array. Bu turning the matrix, that is, by multiplying its every element by a certain number, we try to find an axis, with the minimum distance the axis and all instruments, i.e. the least total variance. The number to multiply each element of the matrix then becomes the angle value, by which the moving instrument should be turned so that it moves in the same direction as other instruments. This angle value is the coefficient for every currency in the portfolio.
If the coefficient value is greater than 0 the currency is bought, if less than 0 — sold. Thus, it is possible to sustain the stationarity of the created synthetic by recalculating the coefficients from time to time. In addition, the PCA does not simply find the axis with the least variance for the portfolio, but several. The number of instruments in the portfolio is the number of components (vectors). Each of them is called the main component, and determines how much it affects the total change of the portfolio movement.
Possible problems
If the chart is not drawn, see what is printed in the Experts tab. Perhaps, there are some errors or synchronizations with other charts is in progress. If there are no messages, click through other timeframes.
The obtained vector values were verified with the once calculated in the R package, so the values themselves are correct. But the sign of a specific coefficient may be wrong, as the РСА does not pay attention to signs. The "-" or "+" sign can only be determined empirically, that is by trial and error.
Problem #2 with has been describes with the pictures here:
Parameters InpVector = 0; // If there are N currencies in portfolio, the movement axis number 0 = maximum variance, N - 1 = minimumInpFrame = 300; // Floating window for calculation of coefficients, for each of InpDepth bars make InpFrame computationsInpDepth = 1000; // The total number of bars in history, for which the chart is drawnInpForward = 500; // The bar to stop recalculating the coefficients and use the previous ones, this is OOSInpPeriod = 1; // Smoothing for the МА, to make the chart look less twitchedInpTimePeriod = PERIOD_CURRENT; // Timeframe for the calculationsInpNormalize = true; // Normalize the prices before displaying them, to smooth the volatility gaps of USDJPY and EURGBPInpSynthetics = true; // Draw the summary synthetic multiplied by the found coefficients or each pair individuallyInpPrices = Logs; // Normalization algorithm of pairsInpSymbols = "AUDUSD,USDCHF,USDCAD"; // Pairs for the portfolioInpMagic = "ID" // Custom name of the indicator, to facilitate placing multiple instances on one chart without conflicts
The idea was adopted from here: