Notis
This tool for MetaTrader 5 is specifically engineered to streamline your trading operations. This technical indicator acts as a specialized analysis tool designed to visualize market data. It helps traders identify emerging trends, momentum shifts, and key support or resistance levels by plotting statistical calculations directly onto price charts.
How to Setup and Use Notis
1. Installation: Place your file in the MQL/Indicators folder via "Open Data Folder" and restart your terminal.
2. Loading: Find the indicator in the Navigator, drag it onto your chart, and configure the input parameters in the popup window.
3. Customization: Press Ctrl+I to open the indicator list, select your tool, and click "Properties" to change colors, levels, or visual styles.
4. Updating: Replace the old file in the Indicators folder with the new version and restart the platform to apply changes.
Frequently Asked Questions
Q: Why is my indicator not showing? A: Verify the file is in the MQL/Indicators folder, or try right-clicking the "Indicators" tree in the Navigator and clicking "Refresh."
Q: Do custom indicators slow down the platform? A: Too many complex indicators can impact performance; remove unused ones via the "Indicator List" (Ctrl+I).
Q: Can I use MT4 indicators on MT5? A: No, MQL4 and MQL5 are distinct languages; ensure the indicator is compiled specifically for your platform version.
Description & Settings
Oscillator Notis% V measures the market volatility, based on the difference between the intraday High and Low.
Volatility is high, when the difference between lines Plus and Minus is large; volatility is low, when the difference is small.
The indicator can work in two modes of calculating and data providing:
Cumulative mode
. In this mode, the indicator behaves as a normal oscillator having one line. In this mode, the indicator chart can also be inverted.
Non-cumulative mode (by default)
. In this mode, the indicator shows two line: Plus and Minus. The difference between the lines points to the volatility level of the market. Crossing - direction.
The indicator has four input parameters:
Period
- calculation period;
Method
- averaging method;
Cumulative mode
- cumulative mode (switch Yes/No);
Inverse in cumulative mode
- inverting the indicator chart in cumulative mode (switch Yes/No).
Calculations:
where:
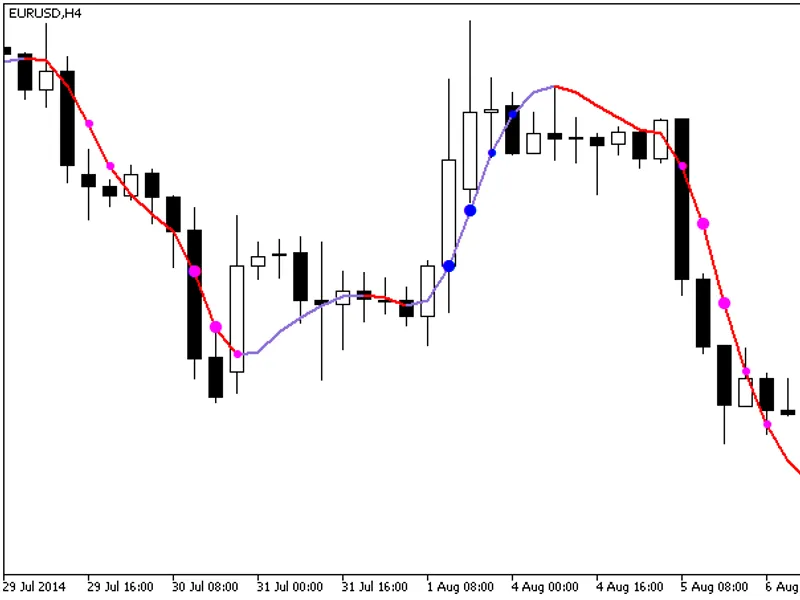
Fig.1. mode by default
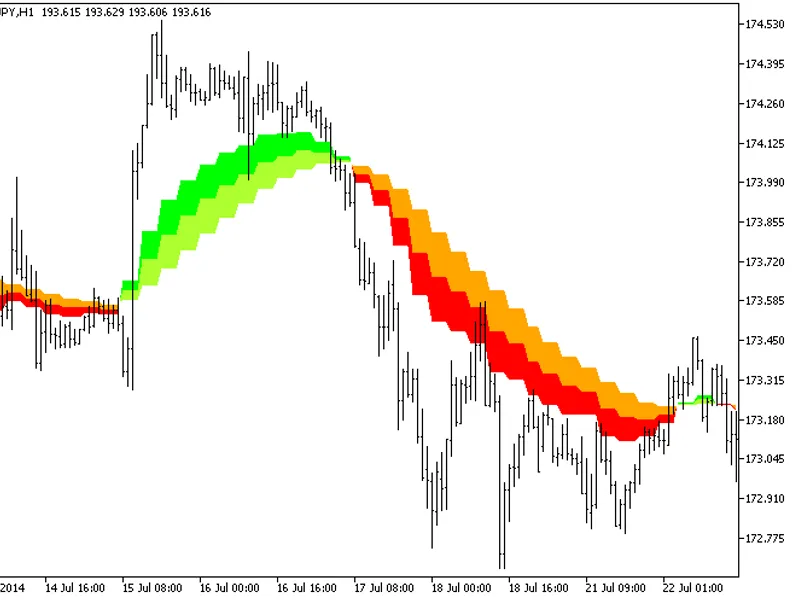
Fig.2. Cumulative mode without inverting
Fig.3. Cumulative mode with inverting