Negative Volume Index
This software component for MetaTrader 5 is built to enhance the capabilities of your trading environment. This technical indicator acts as a specialized analysis tool designed to visualize market data. It helps traders identify emerging trends, momentum shifts, and key support or resistance levels by plotting statistical calculations directly onto price charts.
How to Setup and Use Negative Volume Index
1. Installation: Place your file in the MQL/Indicators folder via "Open Data Folder" and restart your terminal.
2. Loading: Find the indicator in the Navigator, drag it onto your chart, and configure the input parameters in the popup window.
3. Customization: Press Ctrl+I to open the indicator list, select your tool, and click "Properties" to change colors, levels, or visual styles.
4. Updating: Replace the old file in the Indicators folder with the new version and restart the platform to apply changes.
Frequently Asked Questions
Q: Why is my indicator not showing? A: Verify the file is in the MQL/Indicators folder, or try right-clicking the "Indicators" tree in the Navigator and clicking "Refresh."
Q: Do custom indicators slow down the platform? A: Too many complex indicators can impact performance; remove unused ones via the "Indicator List" (Ctrl+I).
Q: Can I use MT4 indicators on MT5? A: No, MQL4 and MQL5 are distinct languages; ensure the indicator is compiled specifically for your platform version.
Description & Settings
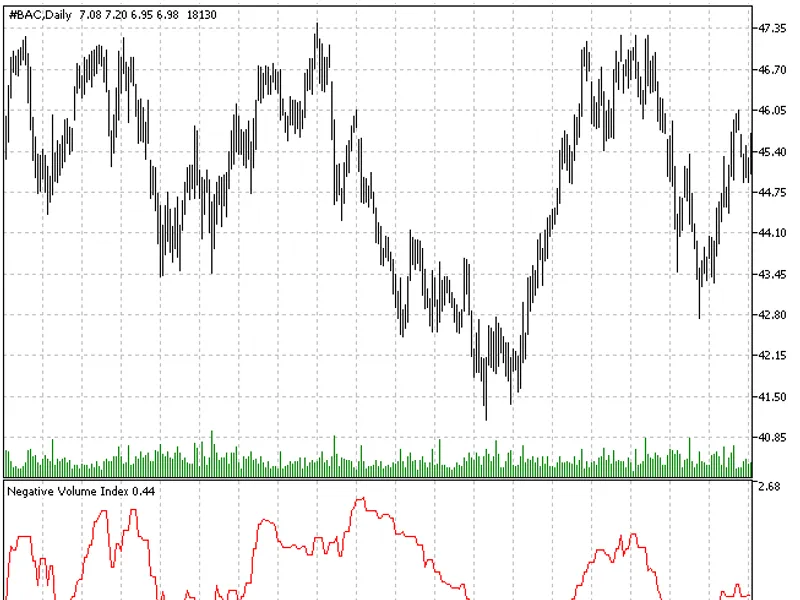
Negative Volume Index (NVI) draws a connection between the volume downfall and financial instrument price change. In case the volume decreases compared to the previous day, NVI is defined by the price percentage change.
NVI indicator is designed so that its value changes only when the current day volume is lower than the previous day one. Due to the fact that the prices fall is often connected with decreasing volumes, NVI usually changes towards a downtrend.
The following assumption is implemented in NVI interpretation. At the time when trading activity is booming and the volume is going up, amateur investors who follow the crowd are most active. In the opposite case, when the volume is decreasing, the market is controlled by professionals making smart money. Therefore, NVI values changes (as it was already noted, NVI changes only when the volume is falling) show that the time for making "smart money" on the market has come.
In his book Norman Fosback shows that, if NVI of Dow Industrials index is higher than its one-year moving average, the market is bullish in 95 out of 100 cases.