MT F Stochastic RS I
This is a powerful addition to your MetaTrader 5 toolkit designed to optimize market analysis and performance. This technical indicator acts as a specialized analysis tool designed to visualize market data. It helps traders identify emerging trends, momentum shifts, and key support or resistance levels by plotting statistical calculations directly onto price charts.
How to Setup and Use MT F Stochastic RS I
1. Installation: Place your file in the MQL/Indicators folder via "Open Data Folder" and restart your terminal.
2. Loading: Find the indicator in the Navigator, drag it onto your chart, and configure the input parameters in the popup window.
3. Customization: Press Ctrl+I to open the indicator list, select your tool, and click "Properties" to change colors, levels, or visual styles.
4. Updating: Replace the old file in the Indicators folder with the new version and restart the platform to apply changes.
Frequently Asked Questions
Q: Why is my indicator not showing? A: Verify the file is in the MQL/Indicators folder, or try right-clicking the "Indicators" tree in the Navigator and clicking "Refresh."
Q: Do custom indicators slow down the platform? A: Too many complex indicators can impact performance; remove unused ones via the "Indicator List" (Ctrl+I).
Q: Can I use MT4 indicators on MT5? A: No, MQL4 and MQL5 are distinct languages; ensure the indicator is compiled specifically for your platform version.
Description & Settings
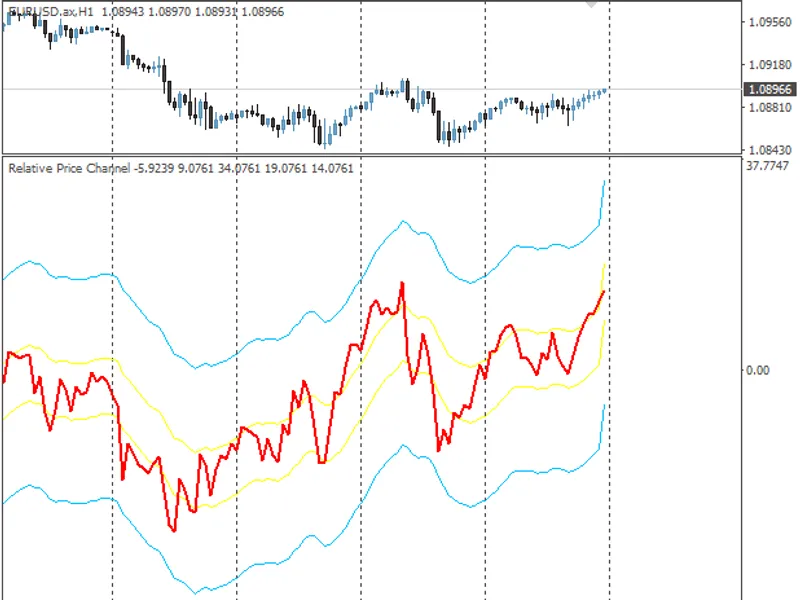
Oscillating indicator Multi timeframes Stochastic RSI is the multi-timeframe .
The indicator displays the data of three indicators from different timeframes on the current chart.
It has ten input parameters:
Stochastic %K period
- stochastic %K line calculation period
Stochastic %D period
- stochastic %D line calculation period
Stochastic slowing
- stochastic slowing calculation period
RSI period
- RSI calculation period
Overbought
- overbought level
Oversold
- oversold level
Drawing mode
- drawing mode
Steps
- by steps
Slope
- by sloping lines
First Stochastic RSI timeframe
- first Stochastic RSI timeframe
Second Stochastic RSI timeframe
- second Stochastic RSI timeframe
Third Stochastic RSI timeframe
- third Stochastic RSI timeframe
Fig. 1. Multi timeframes Stochastic RSI, Drawing mode = Steps
Fig. 2. Multi timeframes Stochastic RSI, Drawing mode = Slope