Modified Standard Deviation. mq5
This tool for MetaTrader 5 is specifically engineered to streamline your trading operations. This technical indicator acts as a specialized analysis tool designed to visualize market data. It helps traders identify emerging trends, momentum shifts, and key support or resistance levels by plotting statistical calculations directly onto price charts.
How to Setup and Use Modified Standard Deviation. mq5
1. Installation: Place your file in the MQL/Indicators folder via "Open Data Folder" and restart your terminal.
2. Loading: Find the indicator in the Navigator, drag it onto your chart, and configure the input parameters in the popup window.
3. Customization: Press Ctrl+I to open the indicator list, select your tool, and click "Properties" to change colors, levels, or visual styles.
4. Updating: Replace the old file in the Indicators folder with the new version and restart the platform to apply changes.
Frequently Asked Questions
Q: Why is my indicator not showing? A: Verify the file is in the MQL/Indicators folder, or try right-clicking the "Indicators" tree in the Navigator and clicking "Refresh."
Q: Do custom indicators slow down the platform? A: Too many complex indicators can impact performance; remove unused ones via the "Indicator List" (Ctrl+I).
Q: Can I use MT4 indicators on MT5? A: No, MQL4 and MQL5 are distinct languages; ensure the indicator is compiled specifically for your platform version.
Description & Settings
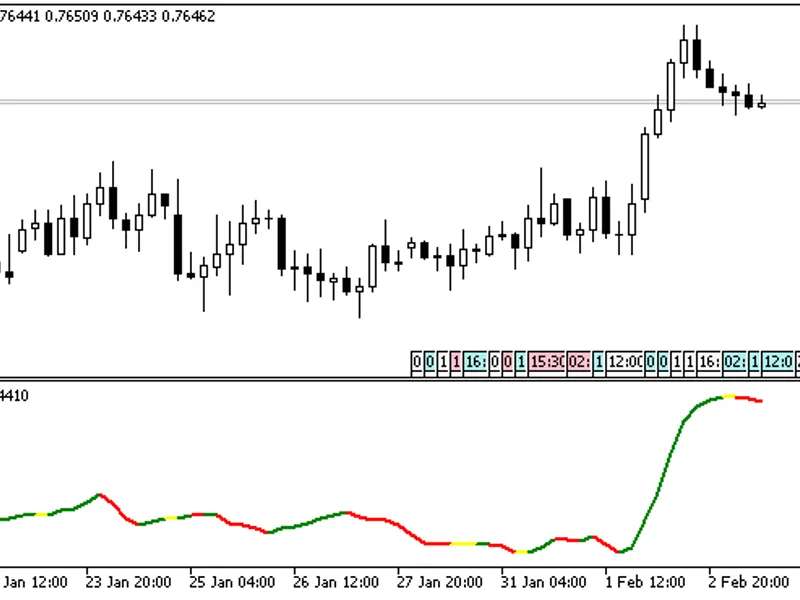
The idea of revising the standard StdDev indicator is to improve the visibility of moments when the indicator values change to growing or falling.
The values can be interpreted as follows.
The moment when the line color changes from red to green indicates the beginning of the trend movement.
When the line color changes from green to red, the trend movement is weakening.
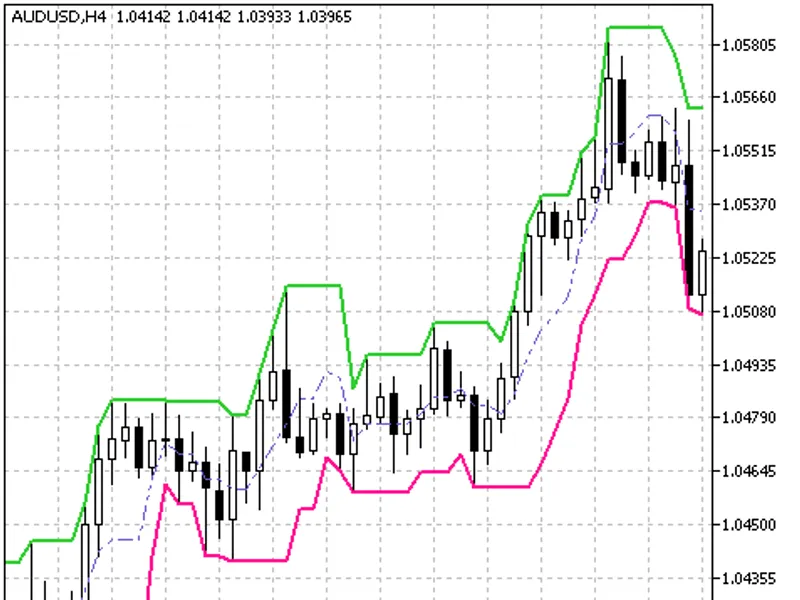
The indicator is traditionally used along with Bollinger Bands. If the price touches the upper Bollinger Band or is close to it, and the color of Modified Standard Deviation changes from red to green, it can be interpreted as the beginning of the uptrend movement. If the price is near the bottom Bollinger Band and Modified Standard Deviation begins to grow, it indicates the beginning of a downward trend.