


Median Price Chart Indicator
Info
The Median Price Chart Indicator is a Indicator for MetaTrader 5 that this indicator is designed to plot a chart with bar-averaged prices, allowing for further analysis and the application of additional indicators. The averaged price chart provides a unique perspective by smoothing out price fluctuations and revealing underlying trends.
Usage
This tool is typically used for enhancing chart analysis and decision making.
Platform
This Indicator works exclusively on MetaTrader 5 (both build 600+ and newer versions).
Setup
Place the downloaded file in MQL5/Indicators folder via File ? Open Data Folder in MetaTrader 5.
How to Install and Use Median Price Chart Indicator
1. Installation: Place your file in the MQL/Indicators folder via "Open Data Folder" and restart your terminal.
2. Loading: Find the indicator in the Navigator, drag it onto your chart, and configure the input parameters in the popup window.
3. Customization: Press Ctrl+I to open the indicator list, select your tool, and click "Properties" to change colors, levels, or visual styles.
4. Updating: Replace the old file in the Indicators folder with the new version and restart the platform to apply changes.
Frequently Asked Questions
Q: Why is my indicator not showing? A: Verify the file is in the MQL/Indicators folder, or try right-clicking the "Indicators" tree in the Navigator and clicking "Refresh."
Q: Do custom indicators slow down the platform? A: Too many complex indicators can impact performance; remove unused ones via the "Indicator List" (Ctrl+I).
Q: Can I use MT4 indicators on MT5? A: No, MQL4 and MQL5 are distinct languages; ensure the indicator is compiled specifically for your platform version.
What this tool does
This indicator is designed to plot a chart with bar-averaged prices, allowing for further analysis and the application of additional indicators.
Typical Use Case
This Indicator excels in automated trading and technical analysis on MetaTrader 5.
Compatible Platform & Setup
This Indicator works on MetaTrader 5. Place the file in the MQL5/Indicators folder and restart the terminal.
Description & Settings
Related: Price Channel Indicator - another powerful indicator for MetaTrader 5 traders.
This indicator is designed to plot a chart with bar-averaged prices, allowing for further analysis and the application of additional indicators.Also recommended: Kinematic Price Physics: Velocity and Acceleration Indicators - similar indicator with strong performance on MetaTrader 5.
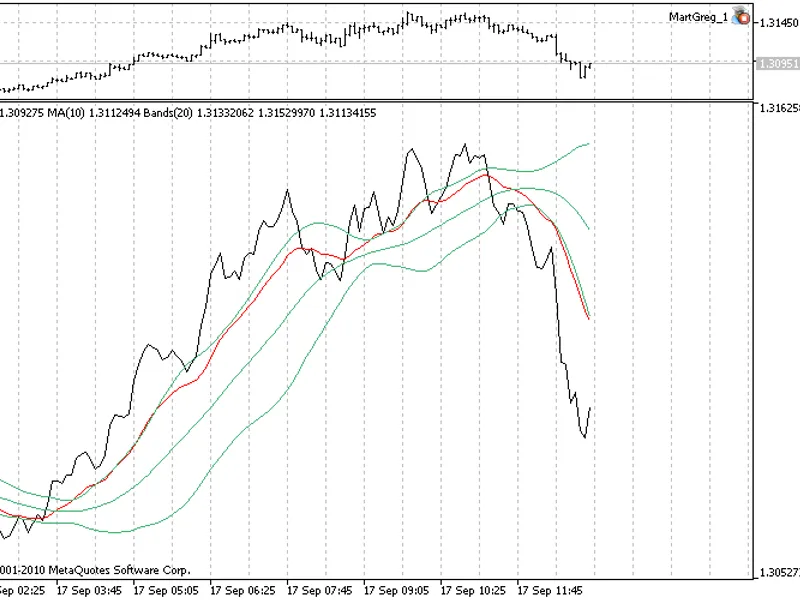
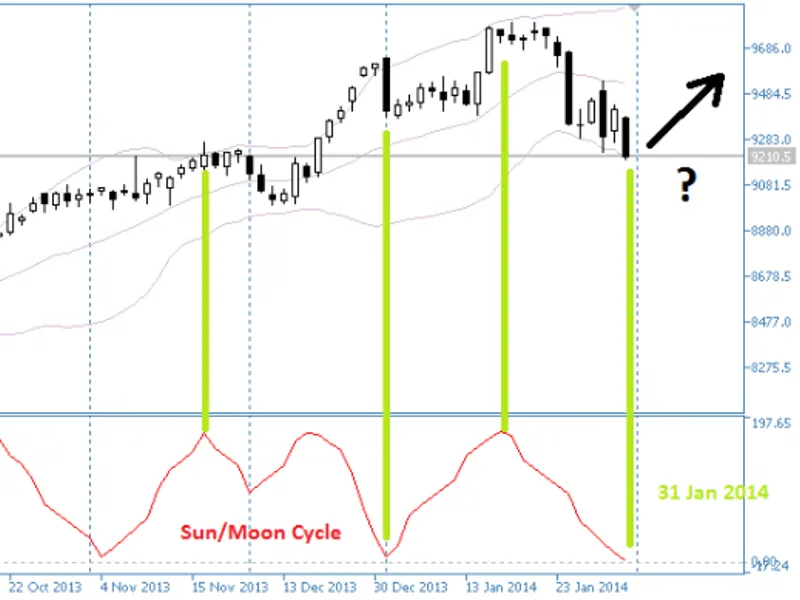
The averaged price chart provides a unique perspective by smoothing out price fluctuations and revealing underlying trends. It can be a valuable tool for traders who want to apply various indicators to a more stable price representation.
For instance, the Moving Average and Bollinger Bands indicators can be overlaid on the averaged price chart, as demonstrated below:
- Moving Average: A popular trend-following indicator that smooths price data, creating a single flowing line to help identify trends.
- Bollinger Bands: A volatility indicator that adds upper and lower bands around a moving average, providing insights into price ranges and potential reversals.
You may also like: Institutional Kalman Filter: Dynamic True Price Estimation - excellent alternative for indicator users on MetaTrader 5.
⚠ Limitations & Risk Warning
- This tool is provided for educational and testing purposes only.
- Past performance does not guarantee future results.
- Trading involves substantial risk of loss. Use on a demo account first.
- Results may vary depending on market conditions, broker, and settings.
- We recommend thorough backtesting and forward testing before using with real funds.