Mass Index
This tool for MetaTrader 5 is specifically engineered to streamline your trading operations. This technical indicator acts as a specialized analysis tool designed to visualize market data. It helps traders identify emerging trends, momentum shifts, and key support or resistance levels by plotting statistical calculations directly onto price charts.
How to Setup and Use Mass Index
1. Installation: Place your file in the MQL/Indicators folder via "Open Data Folder" and restart your terminal.
2. Loading: Find the indicator in the Navigator, drag it onto your chart, and configure the input parameters in the popup window.
3. Customization: Press Ctrl+I to open the indicator list, select your tool, and click "Properties" to change colors, levels, or visual styles.
4. Updating: Replace the old file in the Indicators folder with the new version and restart the platform to apply changes.
Frequently Asked Questions
Q: Why is my indicator not showing? A: Verify the file is in the MQL/Indicators folder, or try right-clicking the "Indicators" tree in the Navigator and clicking "Refresh."
Q: Do custom indicators slow down the platform? A: Too many complex indicators can impact performance; remove unused ones via the "Indicator List" (Ctrl+I).
Q: Can I use MT4 indicators on MT5? A: No, MQL4 and MQL5 are distinct languages; ensure the indicator is compiled specifically for your platform version.
Description & Settings
The Mass Index is developed to catch the trend reversal points. The mass index was created by Donald Dorcy. In case the movement is considerable the Mass Index goes up, otherwise if it is slight the Mass Index goes down. The daily prices movements are used for this purpose.
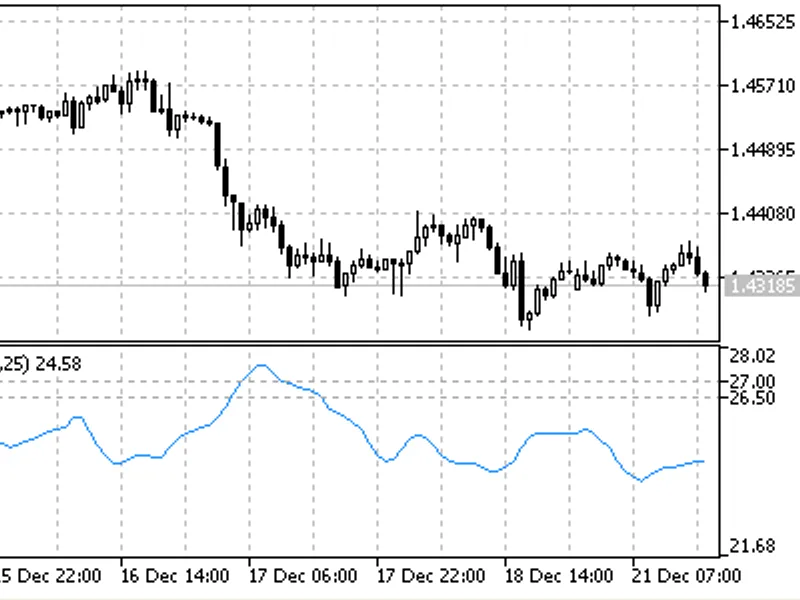
According to D.Dorcy, the most important mass index signal is a special model formed by the indicator. It is called "reversal bulge". It is formed when a 25-period mass index first rises above 27 and then falls below 26,5. In this case a turn of prices can take place, independently of the general trend (the prices may move up or down or fluctuate within a trade corridor).
To find out which signal - for buy or for sell - the reverse bulge gives, people often use 9-period exponential moving average of prices. When a reverse bulge appears, you should buy if the moving average falls (in hope of a turn) and sell if it grows.
Mass Index indicator
Calculation: MI = SUM (EMA (HIGH - LOW, 9) / EMA (EMA (HIGH - LOW, 9), 9), N)
where:
SUM - means a sum;
HIGH - the maximum price of the current bar;
LOW - the minimum price of the current bar;
EMA - the exponential moving average;
N - the period of the indicator (the number of values added).