MA M A + FA M A Multi Timeframe
This professional-grade solution for MetaTrader 5 helps traders achieve greater efficiency in their daily workflow. This technical indicator acts as a specialized analysis tool designed to visualize market data. It helps traders identify emerging trends, momentum shifts, and key support or resistance levels by plotting statistical calculations directly onto price charts.
How to Setup and Use MA M A + FA M A Multi Timeframe
1. Installation: Place your file in the MQL/Indicators folder via "Open Data Folder" and restart your terminal.
2. Loading: Find the indicator in the Navigator, drag it onto your chart, and configure the input parameters in the popup window.
3. Customization: Press Ctrl+I to open the indicator list, select your tool, and click "Properties" to change colors, levels, or visual styles.
4. Updating: Replace the old file in the Indicators folder with the new version and restart the platform to apply changes.
Frequently Asked Questions
Q: Why is my indicator not showing? A: Verify the file is in the MQL/Indicators folder, or try right-clicking the "Indicators" tree in the Navigator and clicking "Refresh."
Q: Do custom indicators slow down the platform? A: Too many complex indicators can impact performance; remove unused ones via the "Indicator List" (Ctrl+I).
Q: Can I use MT4 indicators on MT5? A: No, MQL4 and MQL5 are distinct languages; ensure the indicator is compiled specifically for your platform version.
Description & Settings
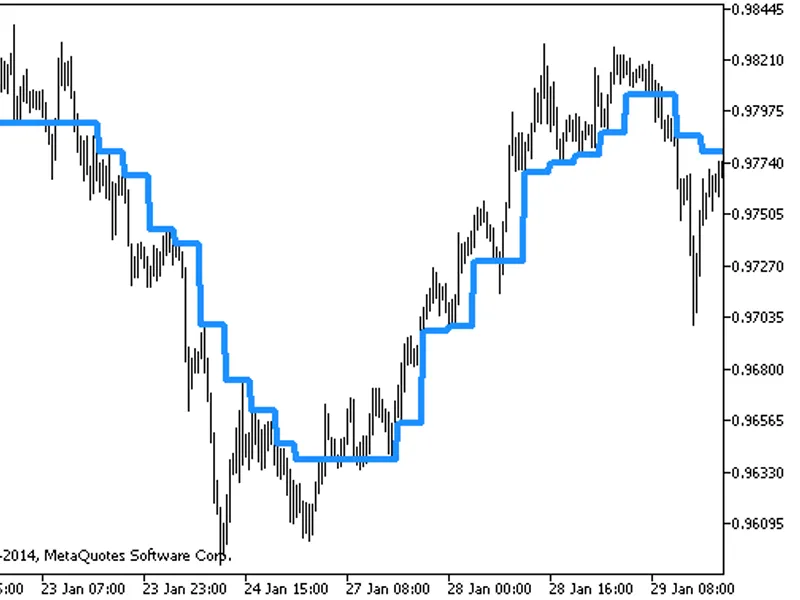
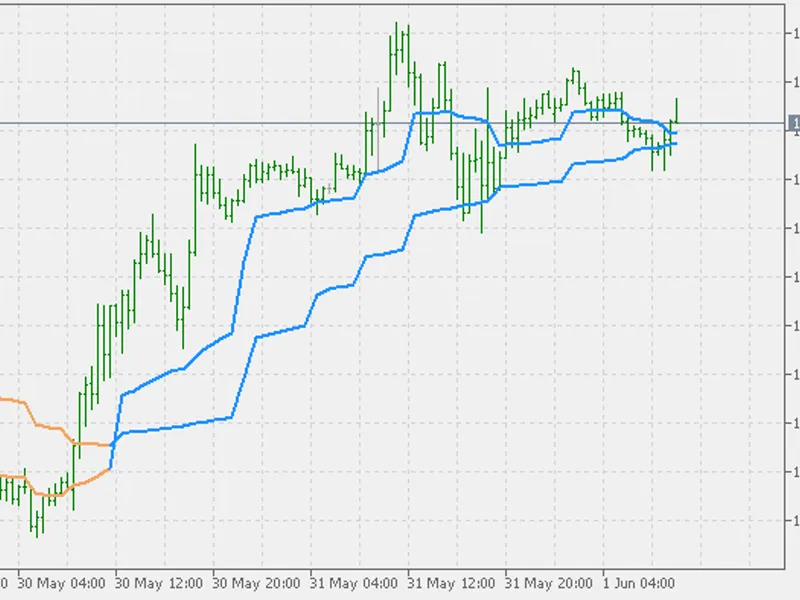
The MESA Adaptive Moving Average (MAMA) and the Following Adaptive Moving Average (FAMA) combination (originally published here ) made to be multi timeframe.
Timeframes supported are all the possible timeframes supported by MetaTrader 5 and it has 3 "special" timeframes:
Next higher timeframe: first higher timeframe compared to active chart.
Second higher timeframe: second higher timeframe compared to active chart.
Third higher timeframe: third higher timeframe compared to active chart.
If some of these 3 timeframes are used, then the timeframe is set automatically as you change the timeframe of the chart.
PPS: one more explanation (for cases when people expect the indicator to be applied to some other indicator) - in cases when the indicator should be applied to some other indicator, that indicator can not be multi timeframe (or some other types of customizing) simply because it entirely depends on the target data. Hence these indicators are not made to be applied to other indicators - to keep the flexibility we have with the choice of timeframes data intact.