Log
This tool for MetaTrader 5 is specifically engineered to streamline your trading operations. This technical indicator acts as a specialized analysis tool designed to visualize market data. It helps traders identify emerging trends, momentum shifts, and key support or resistance levels by plotting statistical calculations directly onto price charts.
How to Setup and Use Log
1. Installation: Place your file in the MQL/Indicators folder via "Open Data Folder" and restart your terminal.
2. Loading: Find the indicator in the Navigator, drag it onto your chart, and configure the input parameters in the popup window.
3. Customization: Press Ctrl+I to open the indicator list, select your tool, and click "Properties" to change colors, levels, or visual styles.
4. Updating: Replace the old file in the Indicators folder with the new version and restart the platform to apply changes.
Frequently Asked Questions
Q: Why is my indicator not showing? A: Verify the file is in the MQL/Indicators folder, or try right-clicking the "Indicators" tree in the Navigator and clicking "Refresh."
Q: Do custom indicators slow down the platform? A: Too many complex indicators can impact performance; remove unused ones via the "Indicator List" (Ctrl+I).
Q: Can I use MT4 indicators on MT5? A: No, MQL4 and MQL5 are distinct languages; ensure the indicator is compiled specifically for your platform version.
Description & Settings
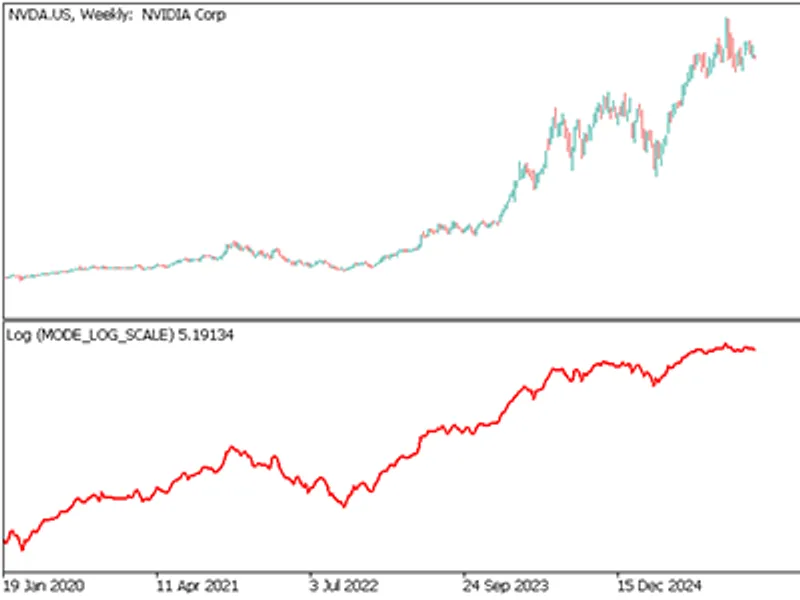
This indicator provides four distinct methods for analyzing price action through logarithmic transformation .By moving away from absolute currency values to relative percentage-based values, it allows for a more accurate assessment of assets with high growth or significant volatility.
How to use this indicator:
Log Scale (Absolute)
Calculation uses the natural logarithm of the current closing price.
Normalizing Exponential Growth.
Ideal for assets like Bitcoin or long-term technology stocks where price has moved from $1 to $1,000+.
It prevents the most recent high prices from visually compressing the older history.
Trends on a log scale represent a constant percentage growth rate rather than a constant dollar increase, making them more reliable over years of data.
Log Scale (Cumulative)
Calculation running sum of all individual log returns.
Performance Tracking.
It creates a "Growth Curve" starting from zero. Unlike absolute price, the cumulative scale
allows you to compare the ROI of different assets (e.g., Gold vs. S&P 500) starting from the same baseline.
Log Returns (Difference)
The difference between the natural log of the current price and the previous price.
Momentum Measurement tool.
Displays the "speed" of price change.
A spike in log returns shows a sudden surge in relative momentum regardless of the absolute price level.
Log Volatility (Deviation)
The Standard Deviation of the Log Returns over a defined period of bars.
Identifying Market Regimes.
It measures "noise" and risk in percentage terms.
A volatility of 0.02 means the asset typically moves ~2% per bar.
Low log volatility often precedes major breakouts, while extreme spikes in log volatility often signal market exhaustion or panic.