KR I
This is a powerful addition to your MetaTrader 5 toolkit designed to optimize market analysis and performance. This technical indicator acts as a specialized analysis tool designed to visualize market data. It helps traders identify emerging trends, momentum shifts, and key support or resistance levels by plotting statistical calculations directly onto price charts.
How to Setup and Use KR I
1. Installation: Place your file in the MQL/Indicators folder via "Open Data Folder" and restart your terminal.
2. Loading: Find the indicator in the Navigator, drag it onto your chart, and configure the input parameters in the popup window.
3. Customization: Press Ctrl+I to open the indicator list, select your tool, and click "Properties" to change colors, levels, or visual styles.
4. Updating: Replace the old file in the Indicators folder with the new version and restart the platform to apply changes.
Frequently Asked Questions
Q: Why is my indicator not showing? A: Verify the file is in the MQL/Indicators folder, or try right-clicking the "Indicators" tree in the Navigator and clicking "Refresh."
Q: Do custom indicators slow down the platform? A: Too many complex indicators can impact performance; remove unused ones via the "Indicator List" (Ctrl+I).
Q: Can I use MT4 indicators on MT5? A: No, MQL4 and MQL5 are distinct languages; ensure the indicator is compiled specifically for your platform version.
Description & Settings
Kairi method (KRI) is similar to according to its application mode.
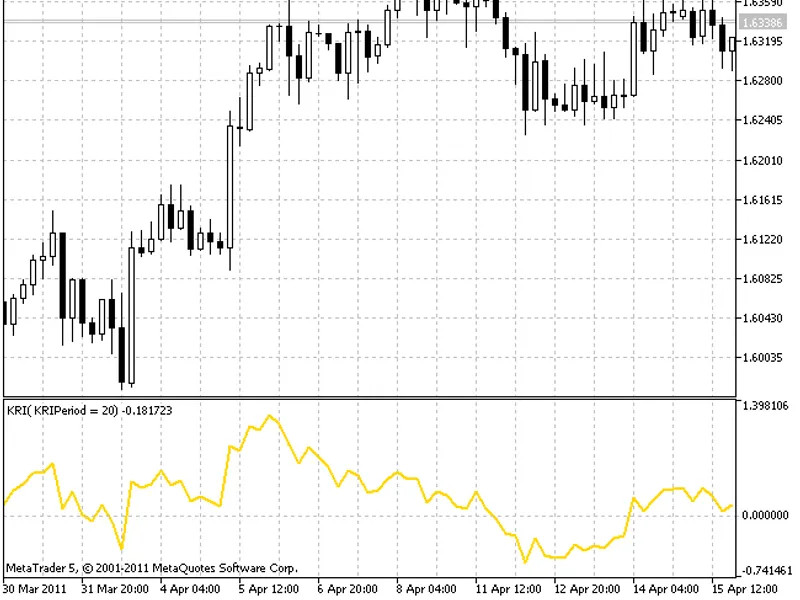
The oscillator fluctuates around 0 but the fluctuation range is wider. Recommended smoothing period - 13. KRI can be used for any time frame. It is one of the simplest oscillators. When creating the indicator, deviation of a price from its is calculated and the reult is shown in percentage of the average.
Indicator calculation formula:
where:
PRICE[bar] - price;
SMA() - smoothing algorithm;
period - SMA() smoothing period;
bar - bar index.
In case the moving of prices has no clearly defined trend, considerable positive value of the KRI indicator means an overcharge and marks a moment for opening a short position. Considerable negative value is a buy signal.
In case of a clearly defined trend, KRI will generate stable positive values during a downward trend because of the time lag between the moving average and the current price. KRI will generate stable negative values during an upward trend. Therefore, if the method values do not change from positive to negative or vice versa for quite a long time, it can be used as a trend indicator.
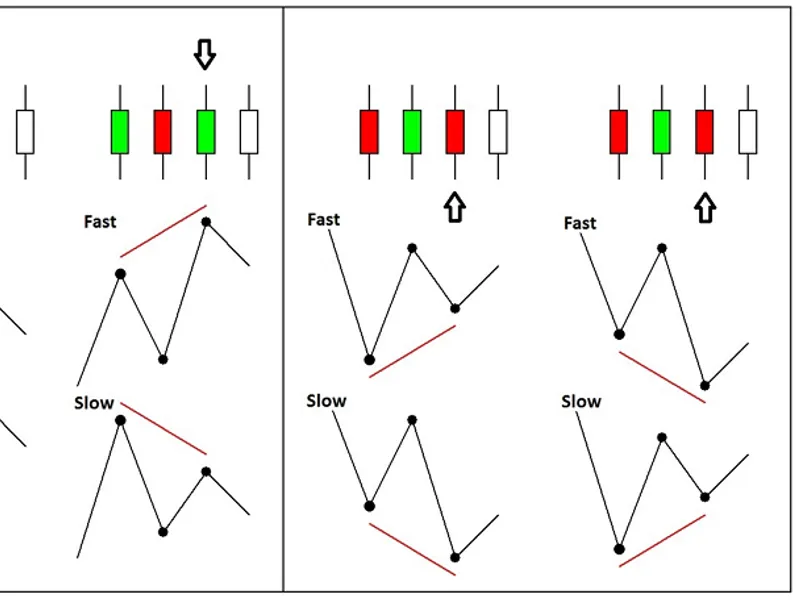
The signals are generated when the indicator values pass above +1 (overbought area) and below -1 (oversold area) and then turn back to the middle. Additional signal is a bullish divergence or a bearish convergence of the indicator and a price.
The indicator uses the СMoving_Average class of the SmoothAlgorithms.mqh library for its compilation. The use of the class was thoroughly described in the article .