MA based Currency Strength Indicator
This tool for MetaTrader 4 is specifically engineered to streamline your trading operations. This technical indicator acts as a specialized analysis tool designed to visualize market data. It helps traders identify emerging trends, momentum shifts, and key support or resistance levels by plotting statistical calculations directly onto price charts.
How to Setup and Use MA based Currency Strength Indicator
1. Installation: Place your file in the MQL/Indicators folder via "Open Data Folder" and restart your terminal.
2. Loading: Find the indicator in the Navigator, drag it onto your chart, and configure the input parameters in the popup window.
3. Customization: Press Ctrl+I to open the indicator list, select your tool, and click "Properties" to change colors, levels, or visual styles.
4. Updating: Replace the old file in the Indicators folder with the new version and restart the platform to apply changes.
Frequently Asked Questions
Q: Why is my indicator not showing? A: Verify the file is in the MQL/Indicators folder, or try right-clicking the "Indicators" tree in the Navigator and clicking "Refresh."
Q: Do custom indicators slow down the platform? A: Too many complex indicators can impact performance; remove unused ones via the "Indicator List" (Ctrl+I).
Q: Can I use MT4 indicators on MT5? A: No, MQL4 and MQL5 are distinct languages; ensure the indicator is compiled specifically for your platform version.
Description & Settings
Note
: New update on 30 Mar 2020 - added support for brokers that use all sorts of prefix/infix/postfix to their symbols. Scroll down for more detailed description.
Description
When we determine that a currency pair, for instance, EURUSD is trending up, we want to know the extent to which EUR is strengthening, and USD weakening. Similarly, if CADJPY is trending down, we want to know the extent to which CAD is weakening, and JPY is strengthening.
A simple way to measure the extent of strengthening/weakening is to look across multiple pairs of currencies and add up the times where each currency play a certain role within each pair. So it'll be meaningful to know that, for example, CAD has been strengthening across all pairs that contain it, and for how many bars already.
Given that there are many currencies being trade, it will be wise to narrow down and focus on just 8 of the major ones - USD, EUR, GBP, CHF, AUD, CAD, JPY and NZD, at least for now, and the combinations of these 8 currencies will be 28 pairs.
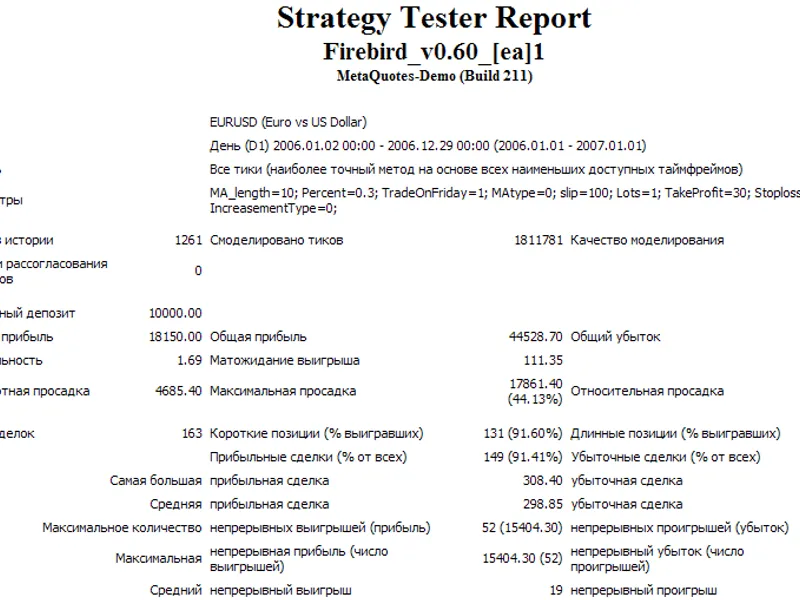
What this indicator does, is to scan through all 28 pairs, determine the strengthening and weakening currency within each pair, and add up the numbers - i.e. number of times each currency is strengthening and weakening, and present it as follows:
From the above screenshot, we can easily conclude that USD is strengthening, and AUD is weakening, and thus AUDUSD is heading south with maximum momentum!
So this indicator provides an easy way, to see, in one glance, the pairs that are worth closer monitoring at any chosen timeframe.
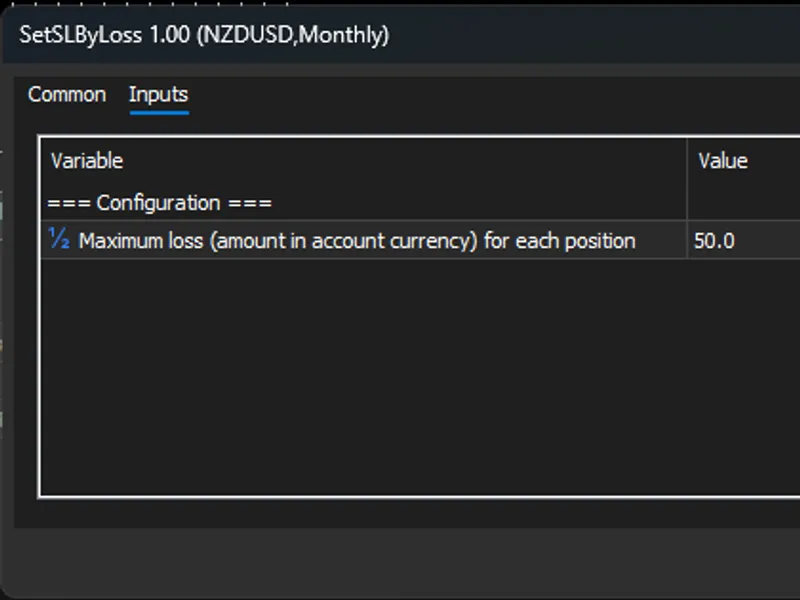
Inputs
The inputs that a user may set, are as follows:
To call this indicator from EA, other indicators or scripts, this function can be used:
And this is an example of how to use the GetCSBuffer() function:
When using this indicator, pay attention to the Experts tab in Terminal, ensure that there are no error messages.
Lastly, for those who are more adventurous, the function GetTrend() can be rewritten (just make sure it takes the same parameters, and return the same value range (i.e. 1 for up, -1 for down, as simple as that) such that different criteria can be used to determine trend. Of course, some changes may require some updates to the input parameters, but nothing too complex - if you have basic knowledge of programming, you can customize it call your own indicators.
Have fun!