KD J Averages
This tool for MetaTrader 5 is specifically engineered to streamline your trading operations. This technical indicator acts as a specialized analysis tool designed to visualize market data. It helps traders identify emerging trends, momentum shifts, and key support or resistance levels by plotting statistical calculations directly onto price charts.
How to Setup and Use KD J Averages
1. Installation: Place your file in the MQL/Indicators folder via "Open Data Folder" and restart your terminal.
2. Loading: Find the indicator in the Navigator, drag it onto your chart, and configure the input parameters in the popup window.
3. Customization: Press Ctrl+I to open the indicator list, select your tool, and click "Properties" to change colors, levels, or visual styles.
4. Updating: Replace the old file in the Indicators folder with the new version and restart the platform to apply changes.
Frequently Asked Questions
Q: Why is my indicator not showing? A: Verify the file is in the MQL/Indicators folder, or try right-clicking the "Indicators" tree in the Navigator and clicking "Refresh."
Q: Do custom indicators slow down the platform? A: Too many complex indicators can impact performance; remove unused ones via the "Indicator List" (Ctrl+I).
Q: Can I use MT4 indicators on MT5? A: No, MQL4 and MQL5 are distinct languages; ensure the indicator is compiled specifically for your platform version.
Description & Settings
KDJ Averages oscillator defines when it is necessary to search for market entry conditions. Unlike , it is calculated using standard smoothing methods. In case of the default settings, its J line is slightly faster.
It has six input parameters:
KDJ period
- KDJ indicator calculation period;
K period
- K line calculation period;
K method
- K line calculation method;
D period
- D line calculation period;
D method
- D line calculation method;
Threshold
- signal line.
Calculation:
where:
Lowest Low, Highest High - the lowest and highest prices within the Period interval.
Possible interpretation options: J line crossing the Threshold level. Up - search the possibility for selling, down - search for the appropriate moment to buy.
After J line crosses the Threshold level, wait till J line is crossed by K and D lines. Crossing direction = market entry direction.
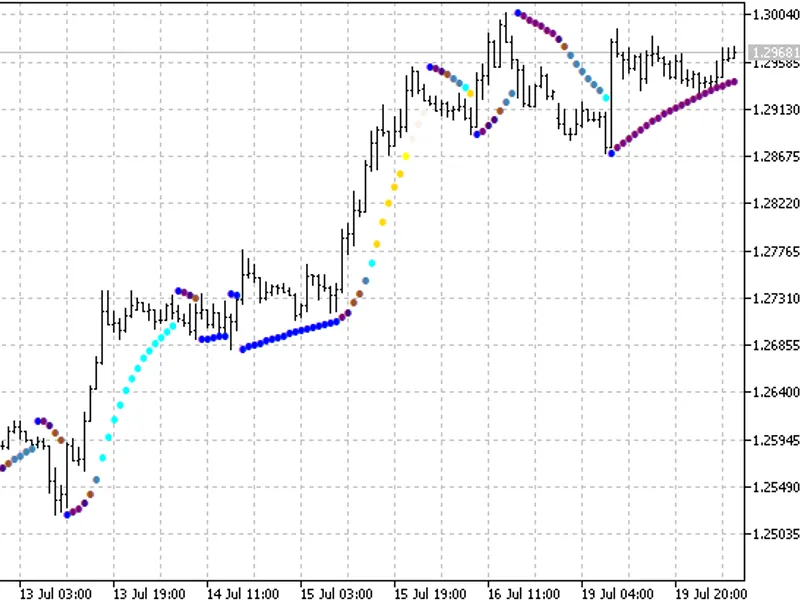
Fig. 1. KDJ Averages
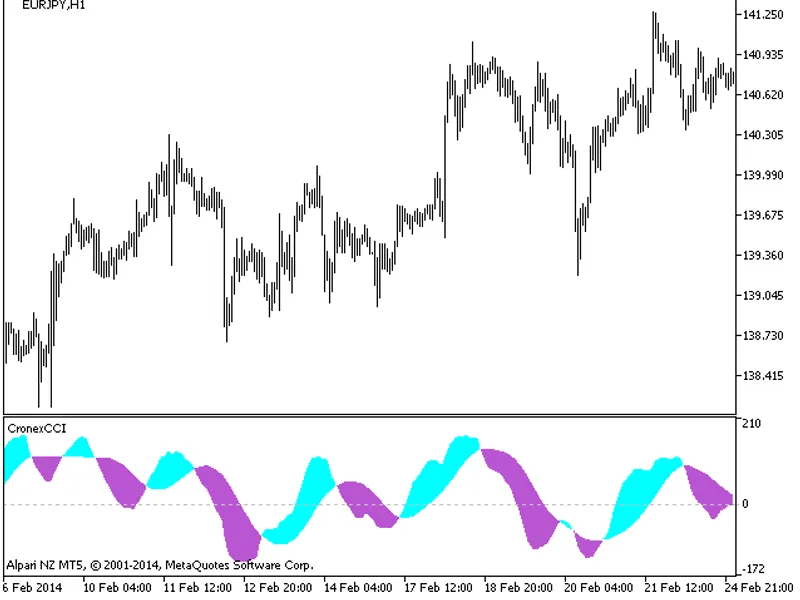
Fig. 2. KDJ Averages compared with KDJ