Bollinger Squeeze Advanced MT5
This tool for MetaTrader 5 is specifically engineered to streamline your trading operations. This technical indicator acts as a specialized analysis tool designed to visualize market data. It helps traders identify emerging trends, momentum shifts, and key support or resistance levels by plotting statistical calculations directly onto price charts.
How to Setup and Use Bollinger Squeeze Advanced MT5
1. Installation: Place your file in the MQL/Indicators folder via "Open Data Folder" and restart your terminal.
2. Loading: Find the indicator in the Navigator, drag it onto your chart, and configure the input parameters in the popup window.
3. Customization: Press Ctrl+I to open the indicator list, select your tool, and click "Properties" to change colors, levels, or visual styles.
4. Updating: Replace the old file in the Indicators folder with the new version and restart the platform to apply changes.
Frequently Asked Questions
Q: Why is my indicator not showing? A: Verify the file is in the MQL/Indicators folder, or try right-clicking the "Indicators" tree in the Navigator and clicking "Refresh."
Q: Do custom indicators slow down the platform? A: Too many complex indicators can impact performance; remove unused ones via the "Indicator List" (Ctrl+I).
Q: Can I use MT4 indicators on MT5? A: No, MQL4 and MQL5 are distinct languages; ensure the indicator is compiled specifically for your platform version.
Description & Settings
Bollinger Squeeze Advanced MetaTrader indicator
— is a complex indicator consisting of two components:
A measure of trendedness based on the Bollinger bands and Keltner channel "squeeze".
A trend direction and strength histogram based on one of the following eight oscillators: Stochastic, CCI, RSI, MACD, Momentum, Williams % Range, ADX, DeMarker.
Bollinger Squeeze Advanced is a part of the Not So Squeezy indicator system.
Input parameters
Timeframe
(default = Current) — the timeframe to draw the data from. The indicator can display higher timeframe data on a lower timeframe chart.
TriggerType
(default = DeMarker) — the oscillator indicator for the trend measurement histogram.
StochasticPeriod
(default = 14) — the period for the Stochastic indicator (if set via
TriggerType
).
CCIPeriod
(default = 50) — the period for the CCI indicator (if set via
TriggerType
).
RSIPeriod
(default = 14) — the period for the RSI indicator (if set via
TriggerType
).
MACDFastEMAPeriod
(default = 12) — the fast EMA period for the MACD indicator (if set via
TriggerType
).
MACDSlowEMAPeriod
(default = 26) — the slow EMA period for the MACD indicator (if set via
TriggerType
).
MACDMACDEMAPeriod
(default = 9) — the signal line period for the MACD indicator (if set via
TriggerType
).
MomentumPeriod
(default = 14) — the period for the Momentum indicator (if set via
TriggerType
).
WilliamsPRPeriod
(default = 24) — the period for the Williams % Range indicator (if set via
TriggerType
).
ADXPeriod
(default = 14) — the period for the ADX indicator (if set via
TriggerType
).
DeMarkerPeriod
(default = 13) — the period for the DeMarker indicator (if set via
TriggerType
).
AlertOnSidewaysTrending
(default = false) — if true, the indicator will issue alerts when market conditions change from Trending to Sideways or vice versa.
AlertOnZeroCross
(default = false) — if true, the indicator will issue alerts when the histogram crosses the zero line or the levels defined via the two input parameters below.
AlertAboveLevel
(default = 0) — an alert level when the indicator's value rises above it.
AlertBelowLevel
(default = 0) — an alert level when the indicator's value falls below it.
EnableNativeAlerts
(default = false) — if true, indicator will use MetaTrader's native pop-up alerts.
EnablePushAlerts
(default = false) — if true, indicator will use MetaTrader's push notification alerts. Notifications should be properly configured in MetaTrader via Tools->Options->Notifications.
TriggerCandle
(default = Previous) — the candle to issue alerts on: Previous — the most recently closed candle or Current — the yet unfinished candle.
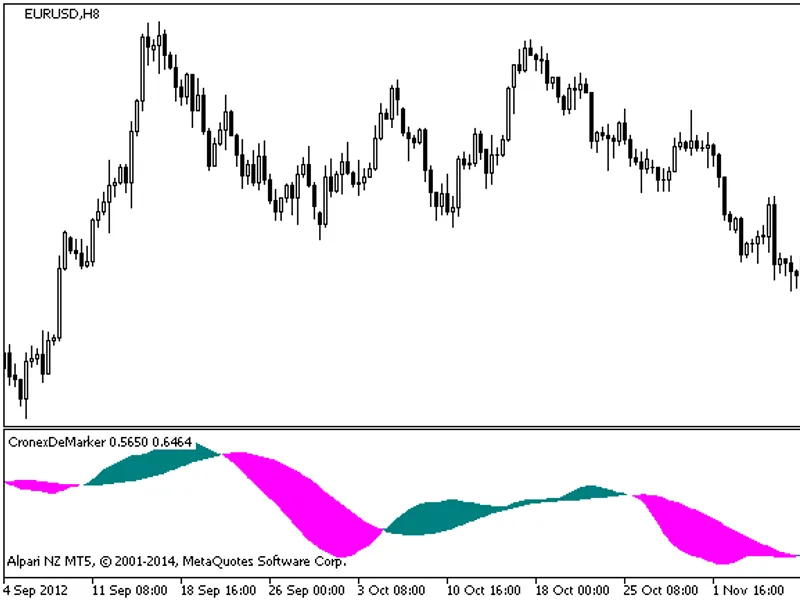
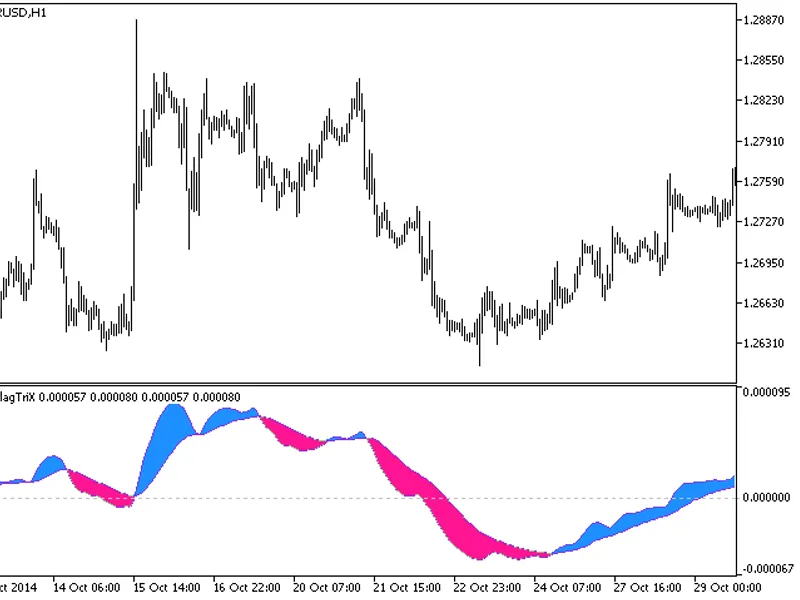
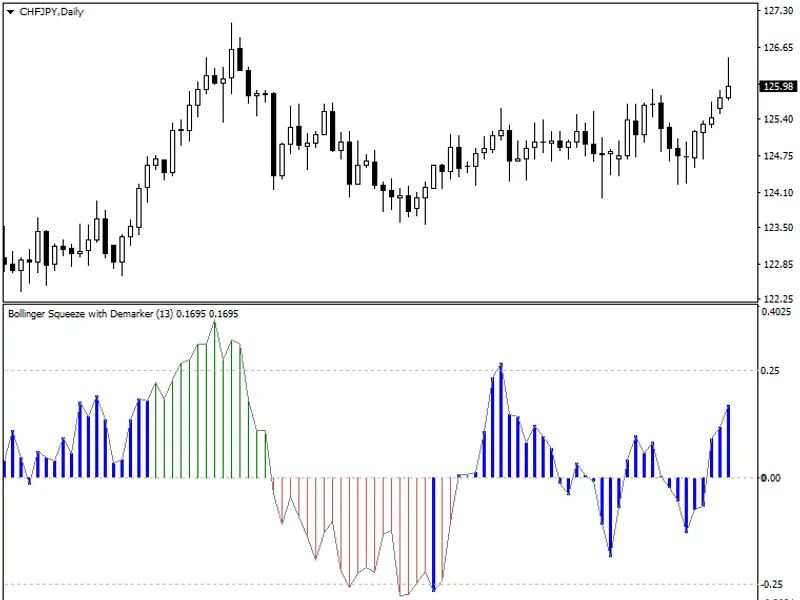
The indicator uses one of the eight oscillator indicators to measure the trend's strength and direction and display it as a histogram:
Uptrend waves are marked with green bars above the zero line.
Downtrend waves are marked with red bars below the zero line.
Additionally, Bollinger Squeeze Advanced provides a volatility measure built into the main histogram. When the Bollinger Squeeze indicates a sideways market (Bollinger bands are inside the Keltner channel), the histogram bars change to thick blue ones.
The main idea behind this indicator is to establish trading ranges during the non-trending phase of the market (blue histogram bars) to enter on a breakout and a switch to normal bars. The histogram will help you understand how strong the current trend is and will tell you when to exit a trade on the trend's weakening.