Inverse Reaction
This is a powerful addition to your MetaTrader 5 toolkit designed to optimize market analysis and performance. This technical indicator acts as a specialized analysis tool designed to visualize market data. It helps traders identify emerging trends, momentum shifts, and key support or resistance levels by plotting statistical calculations directly onto price charts.
How to Setup and Use Inverse Reaction
1. Installation: Place your file in the MQL/Indicators folder via "Open Data Folder" and restart your terminal.
2. Loading: Find the indicator in the Navigator, drag it onto your chart, and configure the input parameters in the popup window.
3. Customization: Press Ctrl+I to open the indicator list, select your tool, and click "Properties" to change colors, levels, or visual styles.
4. Updating: Replace the old file in the Indicators folder with the new version and restart the platform to apply changes.
Frequently Asked Questions
Q: Why is my indicator not showing? A: Verify the file is in the MQL/Indicators folder, or try right-clicking the "Indicators" tree in the Navigator and clicking "Refresh."
Q: Do custom indicators slow down the platform? A: Too many complex indicators can impact performance; remove unused ones via the "Indicator List" (Ctrl+I).
Q: Can I use MT4 indicators on MT5? A: No, MQL4 and MQL5 are distinct languages; ensure the indicator is compiled specifically for your platform version.
Description & Settings
The idea behind the InverseReaction indicator is that an unusual impact in price changes will be adjusted by an inverse reaction. You can see this in many examples like the Lehman Bros. case and in the Flash Crash or even in many daily little shocks (its not necessarily a boom or a crash).
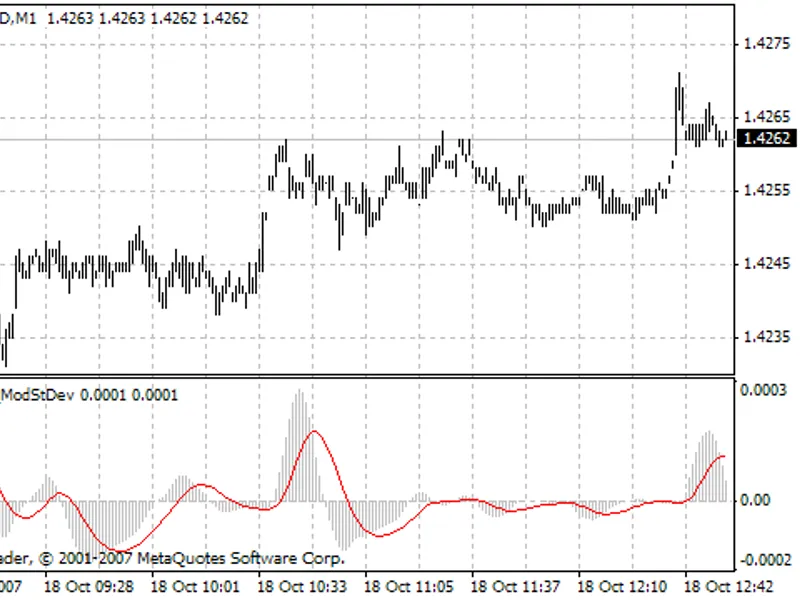
It consists of two main arrays. One shows the gap-free price changes and the other(s) shows the possible volatility limit(s) (confidence levels) for each bar. The signal comes out when the price change exceeds the possible volatility limits. Then you can expect an inverse reaction. See the image below (EURUSD, 1D).
Input Parameters:
Coefficient
Coefficient for confidence levels. It is set with Golden Ratio as default. With the perfect conditions of normality, Golden Ratio gives us nearly 80% confidence levels (see the sourcecode for details). Optionally, you can do small changes (use values between 1 and 3). However, you should know: Higher values lead to higher probabilities but less signals, and the lower values may lead to more false signals.
Period
The period value for moving average. It is set with 3 as default. You can change it optionally, but you should know: Because of the memory is very short in such economic behaviors, higher values may lead to more false signals.
If you are curious about further details of the calculation process, please see the notes about "dynamic confidence levels" in the source code.
Tips:
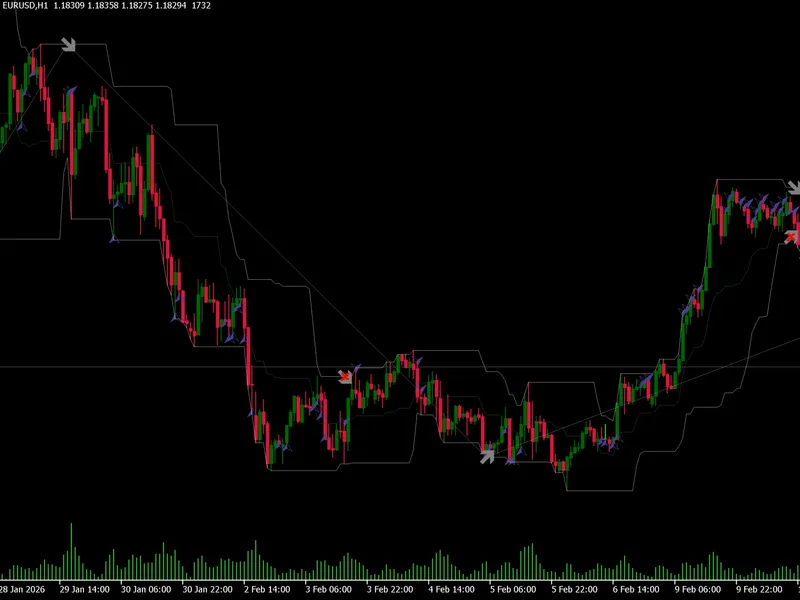
This strategy can be useful alone (see the expert to learn more). But if you like stronger signals, you should use it with complementary strategies like trend and momentum indicators. My favourites are 'Parabolic SAR' and 'Stochastic Oscillator' (see the picture below).
Daily EURUSD is my favourite, though you can adapt it to other periods (and symbols) by changing the parameters. See the picture below for an example.
When it signals successively, the second one may be false, because of an increment in real volatility levels.
There are some identical false signals characterised by low volatility levels.
Please remember: Breaking news can change the signal quality. So follow the news and decide well.
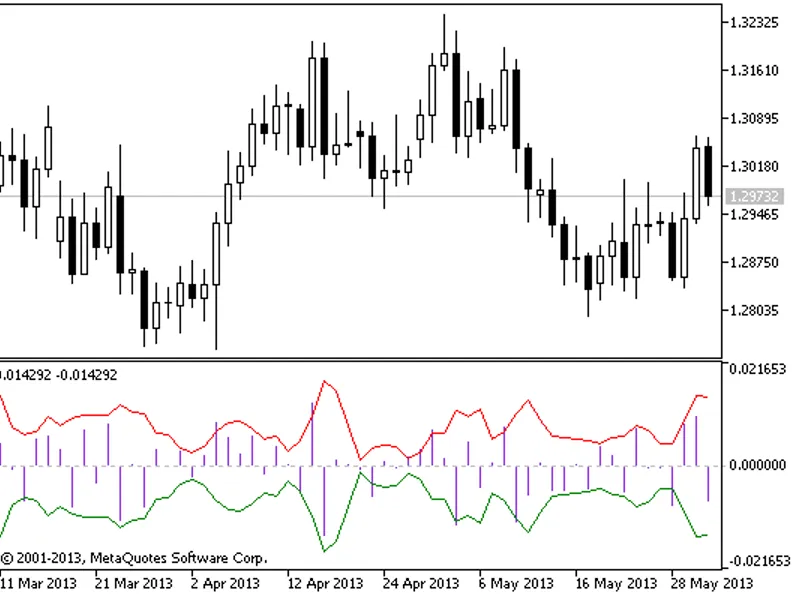
An example for the first three tips:
In the picture, it's attached to GBPUSD, M30 chart. Parameters are: Confidence Coefficient = 2.0, MA Period = 5. The dots represent the single tail confidence levels, and the yellow ones are level breaks (our signals). You can see the relation with 'Stochastic Oscillator' here: When the 'Stochastic Oscillator' reaches its limits, the following volatility breaks of price changes will be excessive and probably responded by Inverse Reactions.