Support Resistance - Tools
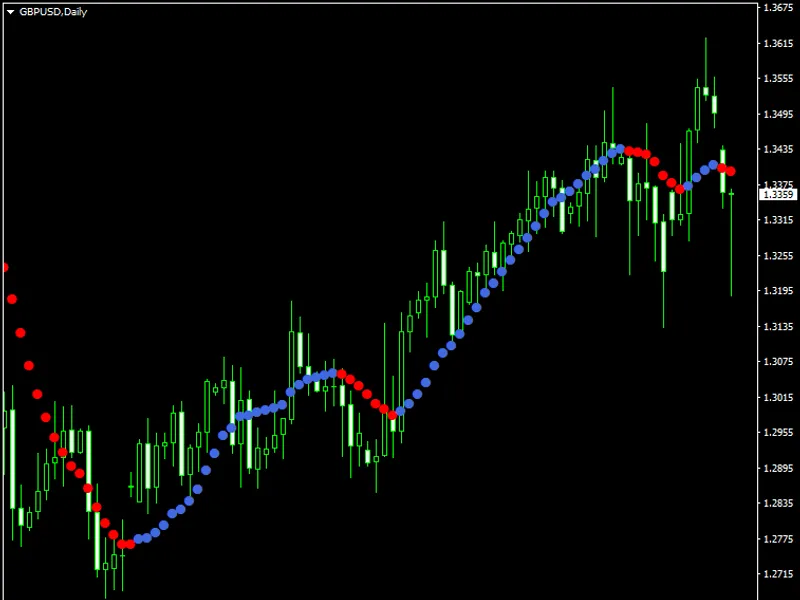
This professional-grade solution for MetaTrader 4 helps traders achieve greater efficiency in their daily workflow. This technical indicator acts as a specialized analysis tool designed to visualize market data. It helps traders identify emerging trends, momentum shifts, and key support or resistance levels by plotting statistical calculations directly onto price charts.
How to Setup and Use Support Resistance - Tools
1. Installation: Place your file in the MQL/Indicators folder via "Open Data Folder" and restart your terminal.
2. Loading: Find the indicator in the Navigator, drag it onto your chart, and configure the input parameters in the popup window.
3. Customization: Press Ctrl+I to open the indicator list, select your tool, and click "Properties" to change colors, levels, or visual styles.
4. Updating: Replace the old file in the Indicators folder with the new version and restart the platform to apply changes.
Frequently Asked Questions
Q: Why is my indicator not showing? A: Verify the file is in the MQL/Indicators folder, or try right-clicking the "Indicators" tree in the Navigator and clicking "Refresh."
Q: Do custom indicators slow down the platform? A: Too many complex indicators can impact performance; remove unused ones via the "Indicator List" (Ctrl+I).
Q: Can I use MT4 indicators on MT5? A: No, MQL4 and MQL5 are distinct languages; ensure the indicator is compiled specifically for your platform version.
Description & Settings
Changelog:
How to use:
Put your mouse cursor where you need to create a line and push "A" key (if you keep the default key), the line will be created automatically, you can do it as many times as you need.
The lines are drawn with the color and style you choose in parameters.
By default, when the price crosses a line you will receive an alert, or a smartphone notification as you like.
Now you can use a secondary line. So you can use the first line for heavy resistance and support and the second one for alert or small resistance and support. If you want more, I can add more.
This tools helps you
create horizontal lines
by just pushing one key on the keyboard, the line will appear at the mouse position.
You can
create as many lines as you want
.
You can
choose two colors
, one for the support line and the other for the resistance line.
You can
delete easily
the last line by a key stroke, you can delete as many lines as you want.
You can
choose to set alarm
, when a support or a resistance line is crossed, the indicator will send an
alarm on the screen or to your smartphone
if you have activated push notifications.
You can use the same windows to see different chart, the indicator automatically hides support and resistance from other symbol and show it again when you come back to the first symbol.
The
color of the line is automatically chosen
, if it's over the market price, it gets a resistance line color, if it's under the market price, it gets a support line color.
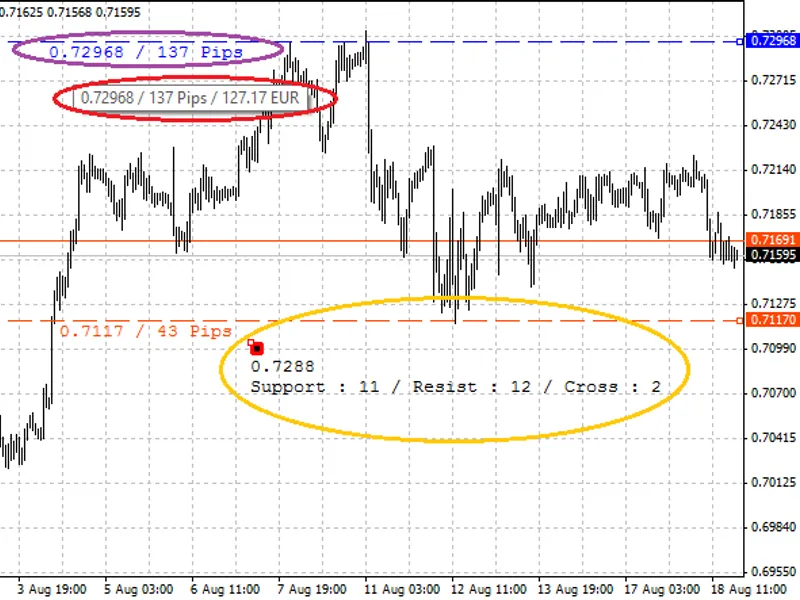
You can see the price of the mouse position in the
top left as comment
, or you can choose to see it
in a floating box.
On the line, you will see the number of
pip separating the line and the actual price
. If you put your mouse over it, you will see
the price.
By clicking on the label of the line, you can see
the number of times the line was used as Support or Resistance and the number of time it has been crossed
; you can choose the number of history. By default it's 200, that means 200 candles in your timeframe, so it can be 200 minutes in M1 or 200 months in MN. You can increase the 200 history if you want. I tried 2000, and it works well. If the candle stops at less than 10 Pips it will appear in the history of support and resistance, but you can change this number in MaxDeviation.
Parameters:
You can see in purple the number of pips separated from the actual price, if you put your mouse on the label or the line, it will show you the value by using your default lot size.
In yellow, you can see the floating box, you can move around the information of mouse price and history in your chart. You can see by clicking in the label of a line the history of the line.
In the blue circle, you can see the price at your mouse cursor position. The line have been created in few seconds, the style and the color are changed automatically.
In this example, you can see that the line 0.71 has color change when the price goes under, and an alert have been send via MetaTrader alert box. But you can choose to have smartphone notification or both.
If you have other idea, you can share it.