
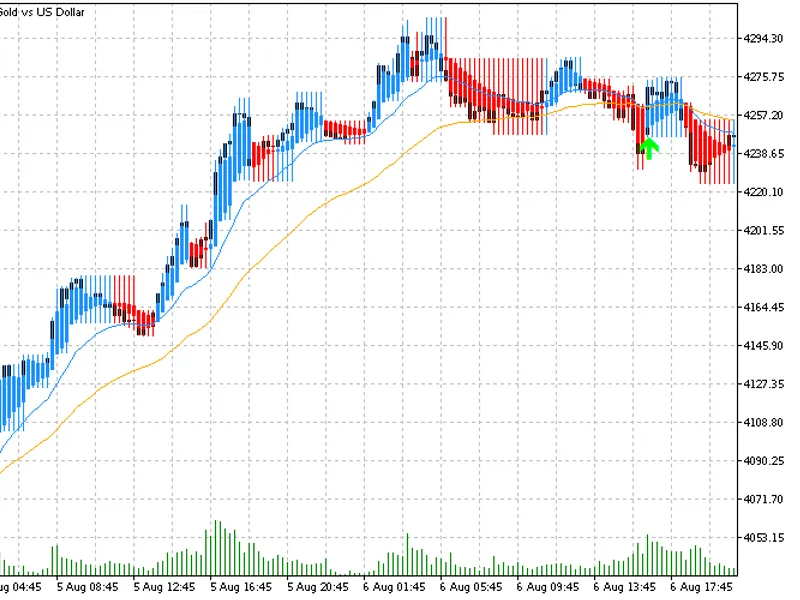
Heikin Ashi Candles Drawn as a Chart Overlay
Info
The Heikin Ashi Candles Drawn as a Chart Overlay is a Indicator for MetaTrader 5 that heikin ashi candles drawn as a chart overlay the idea behind it heikin ashi ("average bar" in japanese) is a candlestick technique that smooths price action. Each candle is built from averaged values instead of the raw open, high, low and close, so consecutive candles of the same color are easier to see and small counter-moves are filtered out.
Usage
This tool is typically used for enhancing chart analysis and decision making.
Platform
This Indicator works exclusively on MetaTrader 5 (both build 600+ and newer versions).
Setup
Place the downloaded file in MQL5/Indicators folder via File ? Open Data Folder in MetaTrader 5.
How to Install and Use Heikin Ashi Candles Drawn as a Chart Overlay
1. Installation: Place your file in the MQL/Indicators folder via "Open Data Folder" and restart your terminal.
2. Loading: Find the indicator in the Navigator, drag it onto your chart, and configure the input parameters in the popup window.
3. Customization: Press Ctrl+I to open the indicator list, select your tool, and click "Properties" to change colors, levels, or visual styles.
4. Updating: Replace the old file in the Indicators folder with the new version and restart the platform to apply changes.
Frequently Asked Questions
Q: Why is my indicator not showing? A: Verify the file is in the MQL/Indicators folder, or try right-clicking the "Indicators" tree in the Navigator and clicking "Refresh."
Q: Do custom indicators slow down the platform? A: Too many complex indicators can impact performance; remove unused ones via the "Indicator List" (Ctrl+I).
Q: Can I use MT4 indicators on MT5? A: No, MQL4 and MQL5 are distinct languages; ensure the indicator is compiled specifically for your platform version.
What this tool does
Heikin Ashi Candles Drawn as a Chart Overlay The idea behind it Heikin Ashi ("average bar" in Japanese) is a candlestick technique that smooths price action.
Typical Use Case
This Indicator excels in automated trading and technical analysis on MetaTrader 5.
Compatible Platform & Setup
This Indicator works on MetaTrader 5. Place the file in the MQL5/Indicators folder and restart the terminal.
Description & Settings
Related: Heikin Ashi Candlesticks - another powerful indicator for MetaTrader 5 traders.
Heikin Ashi Candles Drawn as a Chart Overlay
The idea behind it
Heikin Ashi ("average bar" in Japanese) is a candlestick technique that smooths price action. Each candle is built from averaged values instead of the raw open, high, low and close, so consecutive candles of the same color are easier to see and small counter-moves are filtered out. The formulas are:
Also recommended: QCL Heikin Flow MT5 - similar indicator with strong performance on MetaTrader 5.
HA Close = (Open + High + Low + Close) / 4 HA Open = (HA Open[prev] + HA Close[prev]) / 2 HA High = max(High, HA Open, HA Close) HA Low = min(Low, HA Open, HA Close)
The first candle of the history uses (Open + Close) / 2 as its HA open. Because every HA open depends on the previous HA candle, the indicator keeps the full history in its buffers and, after the first run, only recalculates the forming bar and new bars.
Many implementations draw Heikin Ashi in a separate window or as a custom symbol. This indicator draws the candles
on the main chart
, in the same price scale as the real candles. It can optionally hide the original candles, so the chart looks like a native Heikin Ashi chart while you keep working with the real symbol, its orders and its other indicators.
How to interpret it
Bullish candle
– HA close above HA open (default: white). A series of bullish candles shows an up-trend.
Bearish candle
– HA close below HA open (default: gray). A series of bearish candles shows a down-trend. If HA close equals HA open (doji), the candle takes the color of the previous candle.
Strong candle
– a bullish candle without a lower shadow (HA open = HA low) or a bearish candle without an upper shadow (HA open = HA high). Such candles usually appear in a steady, accelerating trend.
Small bodies with shadows on both sides
– indecision, consolidation or a possible trend change.
Color change
– the first candle of the opposite color is an early warning of a trend change; the signal is confirmed only when the candle is closed.
Status label
– shows
BULL
or
BEAR
, the word
(strong)
if the candle has no shadow against the trend, and the run length: how many consecutive candles have the same color. The values are taken from the last
closed
bar, so the label does not flicker. The label is a chart object that is deleted when the indicator is removed.
Prices are not real
– HA open and close are averages. Do not use them as entry prices or as exact stop levels; use the real prices (the Data Window shows HA Open, HA High, HA Low and HA Close of the candle).
The indicator draws in the main chart window. For iCustom() the buffers are: 0 – HA open, 1 – HA high, 2 – HA low, 3 – HA close, 4 – color index (0 = bullish, 1 = bearish).
External variables (inputs)
Input
Default
Purpose
InpBullColor
clrWhite
Color of bullish Heikin Ashi candles.
InpBearColor
clrGray
Color of bearish Heikin Ashi candles.
InpHideChartCandles
true
Hide the original chart candles. The indicator saves the chart colors, paints candles, bars and line with the background color, and turns off the "Chart on foreground" option. Everything is restored in OnDeinit() .
InpShowStatus
true
Show or hide the on-chart status label.
InpCorner
CORNER_LEFT_UPPER
Chart corner in which the status label is placed.
InpStatusColor
clrWhite
Color of the status label text.
Recommended use
Symbols and timeframes
– works on any symbol and timeframe. Heikin Ashi is most useful on trending instruments and on H1–D1 charts, where smoothing removes noise without hiding the structure.
Trend following
– stay with the trend while candles keep the same color, and become careful when bodies shrink and shadows appear on both sides. Combine it with a trailing stop or a moving average to define exits.
Hiding original candles
– with
InpHideChartCandles
= true the chart looks like a Heikin Ashi chart. Set it to false if you want to see both kinds of candles; in this case, if the original candles cover the HA candles, disable the "Chart on foreground" option (F8 → Common).
Restoring the chart
– the original colors are restored when the indicator is removed or the chart is closed. If the terminal crashes while the indicator is attached, restore the chart colors manually (F8 → Colors) or apply a template. Use only one instance with
InpHideChartCandles
= true per chart.
Caveats
– Heikin Ashi lags the real price and hides gaps, because every candle opens at the middle of the previous HA body. The values of closed bars do not change, but the forming candle changes with every tick. In sideways markets the colors alternate frequently and give false signals.
Account types
– the indicator only reads price data and does not trade, so it works the same on netting and hedging accounts.
Performance
– the whole history is calculated once; afterwards only the forming and new bars are recalculated ( prev_calculated ).
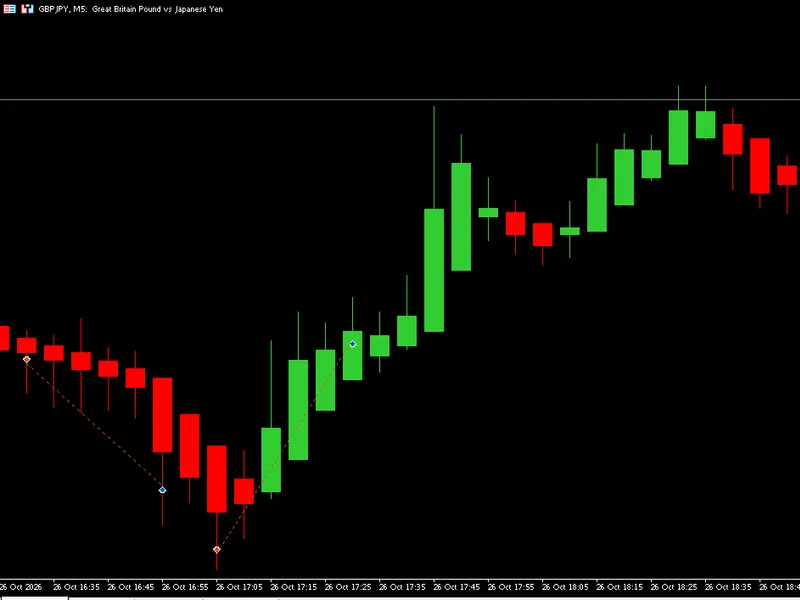
Fig. 1. Heikin Ashi candles drawn over the chart with the original candles hidden (bullish – white, bearish – gray) and the status label; black & white image according to the Code Base image guidelines.
You may also like: Heiken Ashi ATR Blend: Smoothed Candles and Early Entry Signals - excellent alternative for indicator users on MetaTrader 5.
Source Code
#property copyright "RobotFX"
#property link "https://robotfx.org"
#property version     "1.00"
#property description "This code is educational. Feel free to use, modify and upgrade as you wish. Visit ROBOTFX.ORG for professional trading tools"
#property indicator_chart_window
#property indicator_buffers 6
#property indicator_plots   1
#property indicator_label1  "HA Open;HA High;HA Low;HA Close"
#property indicator_type1   DRAW_COLOR_CANDLES
#property indicator_color1  clrWhite,clrGray
.......
⚠ Limitations & Risk Warning
- This tool is provided for educational and testing purposes only.
- Past performance does not guarantee future results.
- Trading involves substantial risk of loss. Use on a demo account first.
- Results may vary depending on market conditions, broker, and settings.
- We recommend thorough backtesting and forward testing before using with real funds.