AI S Extremum
This tool for MetaTrader 5 is specifically engineered to streamline your trading operations. This technical indicator acts as a specialized analysis tool designed to visualize market data. It helps traders identify emerging trends, momentum shifts, and key support or resistance levels by plotting statistical calculations directly onto price charts.
How to Setup and Use AI S Extremum
1. Installation: Place your file in the MQL/Indicators folder via "Open Data Folder" and restart your terminal.
2. Loading: Find the indicator in the Navigator, drag it onto your chart, and configure the input parameters in the popup window.
3. Customization: Press Ctrl+I to open the indicator list, select your tool, and click "Properties" to change colors, levels, or visual styles.
4. Updating: Replace the old file in the Indicators folder with the new version and restart the platform to apply changes.
Frequently Asked Questions
Q: Why is my indicator not showing? A: Verify the file is in the MQL/Indicators folder, or try right-clicking the "Indicators" tree in the Navigator and clicking "Refresh."
Q: Do custom indicators slow down the platform? A: Too many complex indicators can impact performance; remove unused ones via the "Indicator List" (Ctrl+I).
Q: Can I use MT4 indicators on MT5? A: No, MQL4 and MQL5 are distinct languages; ensure the indicator is compiled specifically for your platform version.
Description & Settings
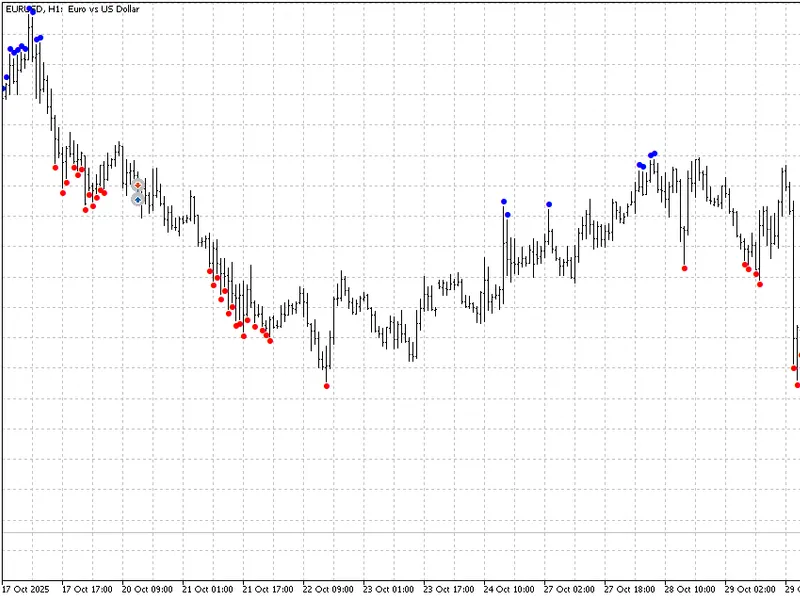
The main task of this indicator is to estimate the probability that the High price has reached its maximum, or the minimum for the Low price.
First, the indicator collects statistics on historical price movements. After that it analyses the current state of the market and compares it with the statistics. If the result of the analysis is positive, the indicator signals about it.
The indicator can be used as an additional filter. If signals of one direction appear, there is a high probability that the price will go in the other direction.
Indicator parameters:
iPeriod
- period of the indicator. The minimum value is equal to 2.
History
- the number of bars in the history, for which the indicator collects statistics. If this parameter is equal to 0, the whole history is analysed. Please note that a large value of this parameter can slow down the first start of the indicator.
Percent
- defines the threshold of triggering of indicator signals. The higher it is, the less frequent the signals are.
The first start of the indicator may take some time. This is due to the fact that it collects statistics on historical data.