Guppy MM A of Double Smoothed Ema
This software component for MetaTrader 5 is built to enhance the capabilities of your trading environment. This technical indicator acts as a specialized analysis tool designed to visualize market data. It helps traders identify emerging trends, momentum shifts, and key support or resistance levels by plotting statistical calculations directly onto price charts.
How to Setup and Use Guppy MM A of Double Smoothed Ema
1. Installation: Place your file in the MQL/Indicators folder via "Open Data Folder" and restart your terminal.
2. Loading: Find the indicator in the Navigator, drag it onto your chart, and configure the input parameters in the popup window.
3. Customization: Press Ctrl+I to open the indicator list, select your tool, and click "Properties" to change colors, levels, or visual styles.
4. Updating: Replace the old file in the Indicators folder with the new version and restart the platform to apply changes.
Frequently Asked Questions
Q: Why is my indicator not showing? A: Verify the file is in the MQL/Indicators folder, or try right-clicking the "Indicators" tree in the Navigator and clicking "Refresh."
Q: Do custom indicators slow down the platform? A: Too many complex indicators can impact performance; remove unused ones via the "Indicator List" (Ctrl+I).
Q: Can I use MT4 indicators on MT5? A: No, MQL4 and MQL5 are distinct languages; ensure the indicator is compiled specifically for your platform version.
Description & Settings
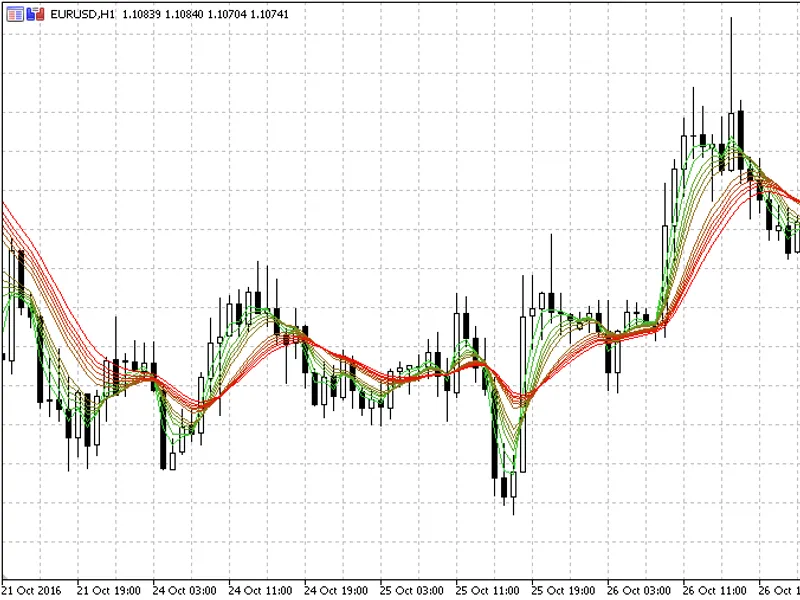
GUPPY MULTIPLE MOVING AVERAGE ™
This indicator was developed by Daryl Guppy. It is fully explained in . Captures the inferred behaviour of traders and investors by using two groups of averages. Uses fractal repetition to identify points of agreement and disagreement which precede significant trend changes.
APPLICATION
Applied to understand the nature and character of the trend. Used to assess the degree and extent of trading activity. Excessive trading activity can destabilise strong trends. Trend analysis enables more effective selection of appropriate trading strategies such as breakout, trend continuation etc. Can be applied to long side and short side trading. Can be applied to intraday trading. Also used for longer term investment style analysis.
TACTICS
Join established trends at points of price weakness
Join established trends breaking to new highs
Trade breakouts using rally dips and rebounds
Trade downtrend rallies as rallies rather than trend breaks
Recognise trend breaks as they develop
RULES
Degree and nature of separation in the long term group define trend strength and weakness
Degree and nature of separation in the short term group define the nature of trading activity.
Degree and nature of separation between the two groups of moving averages define the character of the trend.
Compression shows agreement on price and value.
Compression of both groups at the same time indicate major re-evaluation of stock and potential for a trend change
Trade in the direction of the long term group of averages
The relationships between the groups provide the necessary information about the nature and character of the trend.
Do not use as a moving average crossover tool
ADVANTAGES
Enables effective analysis of the trend environment
Improves selection of the appropriate trading tactics
Better understanding of trend strength
Effective evaluation of unusual price movements, such as dips and spikes
Effective understanding of trading activity and behavior
DISADVANTAGES
Not effectively applied to trend less stocks
Cannot be applied to all trending stocks
Do not use as a moving average crossover signal
Coloring for the intermediate values is done automatically, so the actual number of parameters is small, and the indicator should be easy to use.