BT F BB
This is a powerful addition to your MetaTrader 5 toolkit designed to optimize market analysis and performance. This technical indicator acts as a specialized analysis tool designed to visualize market data. It helps traders identify emerging trends, momentum shifts, and key support or resistance levels by plotting statistical calculations directly onto price charts.
How to Setup and Use BT F BB
1. Installation: Place your file in the MQL/Indicators folder via "Open Data Folder" and restart your terminal.
2. Loading: Find the indicator in the Navigator, drag it onto your chart, and configure the input parameters in the popup window.
3. Customization: Press Ctrl+I to open the indicator list, select your tool, and click "Properties" to change colors, levels, or visual styles.
4. Updating: Replace the old file in the Indicators folder with the new version and restart the platform to apply changes.
Frequently Asked Questions
Q: Why is my indicator not showing? A: Verify the file is in the MQL/Indicators folder, or try right-clicking the "Indicators" tree in the Navigator and clicking "Refresh."
Q: Do custom indicators slow down the platform? A: Too many complex indicators can impact performance; remove unused ones via the "Indicator List" (Ctrl+I).
Q: Can I use MT4 indicators on MT5? A: No, MQL4 and MQL5 are distinct languages; ensure the indicator is compiled specifically for your platform version.
Description & Settings
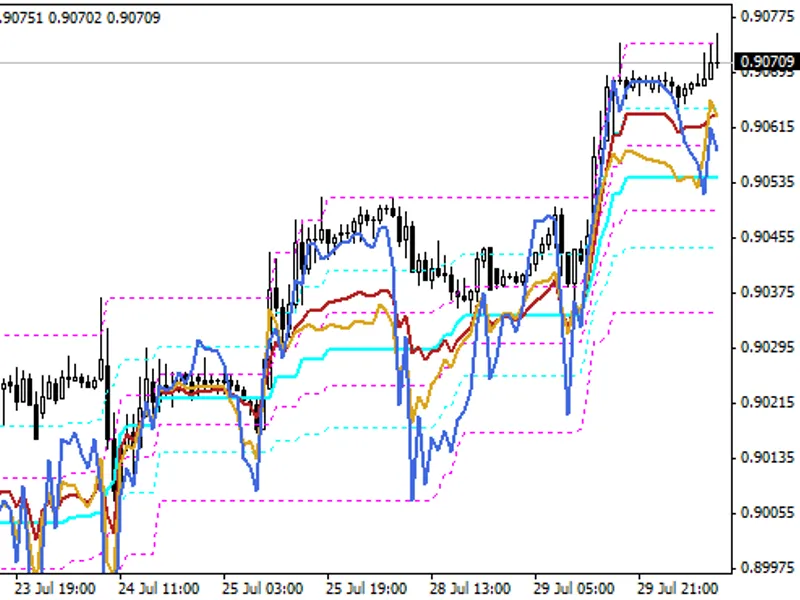
Bigger Time Frame Bollinger Bands displays Bolinger Bands indicator data of a higher timeframe on the current one.
The indicator has nine adjustable parameters:
BB period
- Bollinger Bands calculation period
BB deviation
- Bollinger Bands deviation value
BB applied price
- Bollinger Bands calculation price
BB timeframe
- displayed Bollinger Bands timeframe
Drawing mode
- indicator drawing type
Steps
- as a ladder
Slope
- inclined lines connecting two neighboring bars of the calculation timeframe
Show middle lines
- show the Bollinger Bands middle line (Yes/No)
Show alerts
- whether to enable alerts (Yes/No)
Send push-notifications
- whether to send push notifications (Yes/No)
Signals are generated when the current Close price moves beyond the upper and lower Bollinger Bands
Fig.1. Bigger Time Frame Bollinger Bands, H4 data on the H1 chart, Drawing mode = Steps
Fig.2. Bigger Time Frame Bollinger Bands, H4 data on the H1 chart, Drawing mode = Slope
Fig.3. Bigger Time Frame Bollinger Bands, H8 data on the H1 chart, Drawing mode = Steps
Fig.4. Bigger Time Frame Bollinger Bands, H8 data on the H1 chart, Drawing mode = Slope