Exp Digit Macd
This professional-grade solution for MetaTrader 5 helps traders achieve greater efficiency in their daily workflow. This technical indicator acts as a specialized analysis tool designed to visualize market data. It helps traders identify emerging trends, momentum shifts, and key support or resistance levels by plotting statistical calculations directly onto price charts.
How to Setup and Use Exp Digit Macd
1. Installation: Place your file in the MQL/Indicators folder via "Open Data Folder" and restart your terminal.
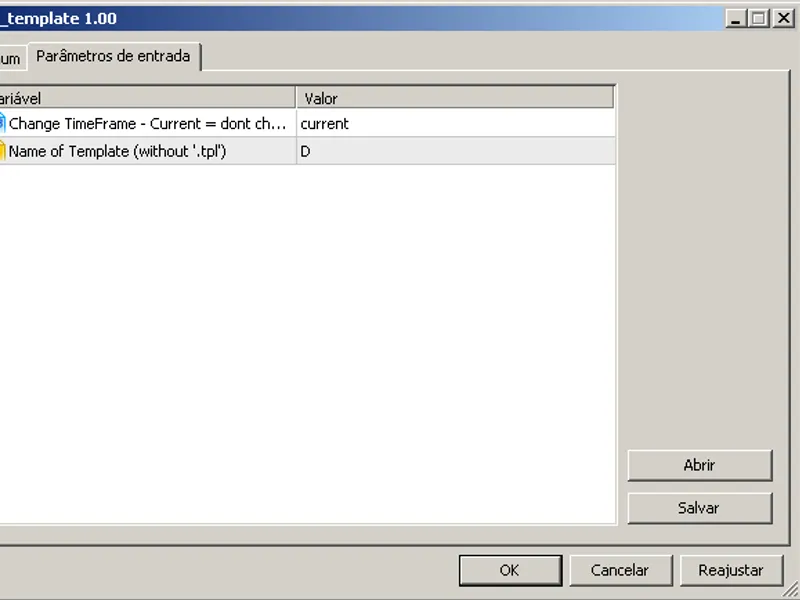
2. Loading: Find the indicator in the Navigator, drag it onto your chart, and configure the input parameters in the popup window.
3. Customization: Press Ctrl+I to open the indicator list, select your tool, and click "Properties" to change colors, levels, or visual styles.
4. Updating: Replace the old file in the Indicators folder with the new version and restart the platform to apply changes.
Frequently Asked Questions
Q: Why is my indicator not showing? A: Verify the file is in the MQL/Indicators folder, or try right-clicking the "Indicators" tree in the Navigator and clicking "Refresh."
Q: Do custom indicators slow down the platform? A: Too many complex indicators can impact performance; remove unused ones via the "Indicator List" (Ctrl+I).
Q: Can I use MT4 indicators on MT5? A: No, MQL4 and MQL5 are distinct languages; ensure the indicator is compiled specifically for your platform version.
Description & Settings
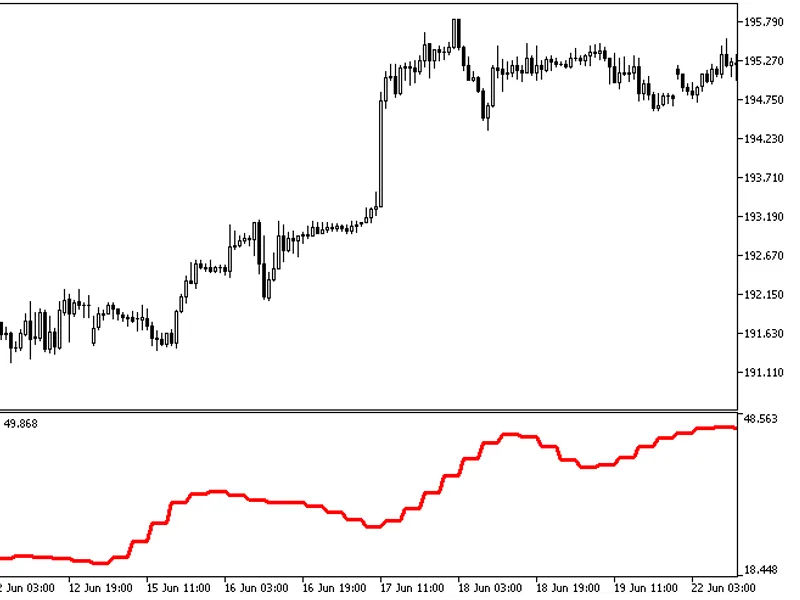
The Exp_DigitMacd EA is based on the signals generated by the oscillator.
The signal is formed when a bar is closing if there is change in cloud color of the indicator.
The Expert Advisor requires the compiled file of the indicator DigitMacd.ex5. Place it to terminal_data_folder\MQL5\Indicators.
Note that the TradeAlgorithms.mqh library file allows using Expert Advisors with brokers who offer
nonzero spread
and the option of setting Stop Loss and Take Profit
together with position opening
. You can download more variants of the library at the following link: .
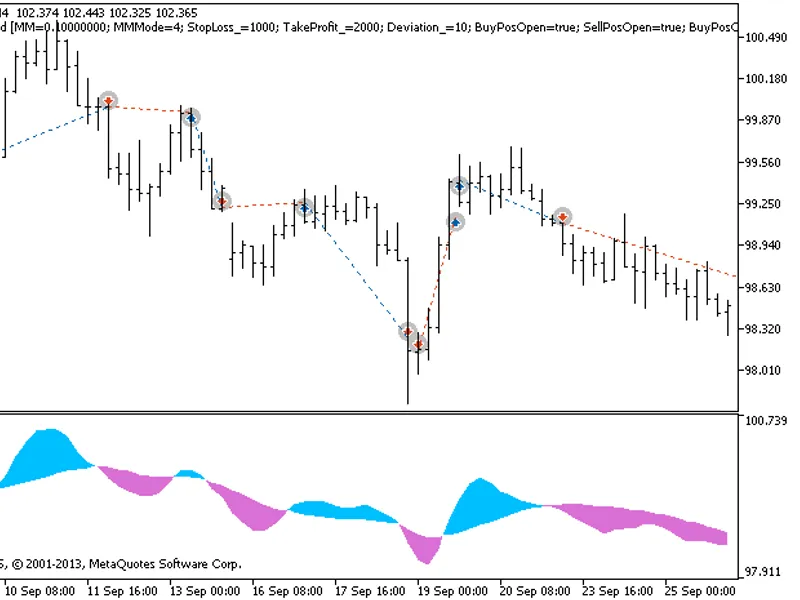
Default Expert Advisor's input parameters have been used during the tests shown below. Stop Loss and Take Profit have not been used during the tests.
Figure 1 The instances of history of deals on the chart.
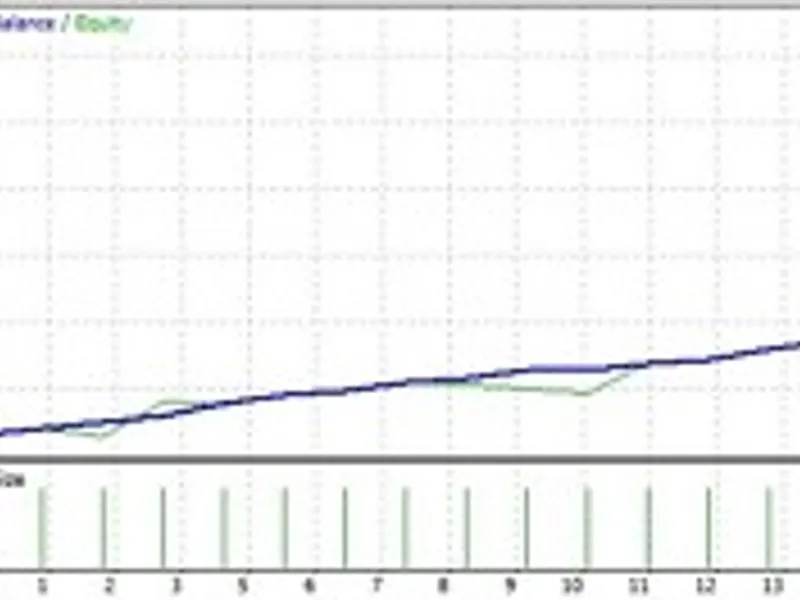
Testing results for 2013 at USDJPY H4:
Figure 2. Chart of testing results