Market Profile MT5
This software component for MetaTrader 5 is built to enhance the capabilities of your trading environment. This technical indicator acts as a specialized analysis tool designed to visualize market data. It helps traders identify emerging trends, momentum shifts, and key support or resistance levels by plotting statistical calculations directly onto price charts.
How to Setup and Use Market Profile MT5
1. Installation: Place your file in the MQL/Indicators folder via "Open Data Folder" and restart your terminal.
2. Loading: Find the indicator in the Navigator, drag it onto your chart, and configure the input parameters in the popup window.
3. Customization: Press Ctrl+I to open the indicator list, select your tool, and click "Properties" to change colors, levels, or visual styles.
4. Updating: Replace the old file in the Indicators folder with the new version and restart the platform to apply changes.
Frequently Asked Questions
Q: Why is my indicator not showing? A: Verify the file is in the MQL/Indicators folder, or try right-clicking the "Indicators" tree in the Navigator and clicking "Refresh."
Q: Do custom indicators slow down the platform? A: Too many complex indicators can impact performance; remove unused ones via the "Indicator List" (Ctrl+I).
Q: Can I use MT4 indicators on MT5? A: No, MQL4 and MQL5 are distinct languages; ensure the indicator is compiled specifically for your platform version.
Description & Settings
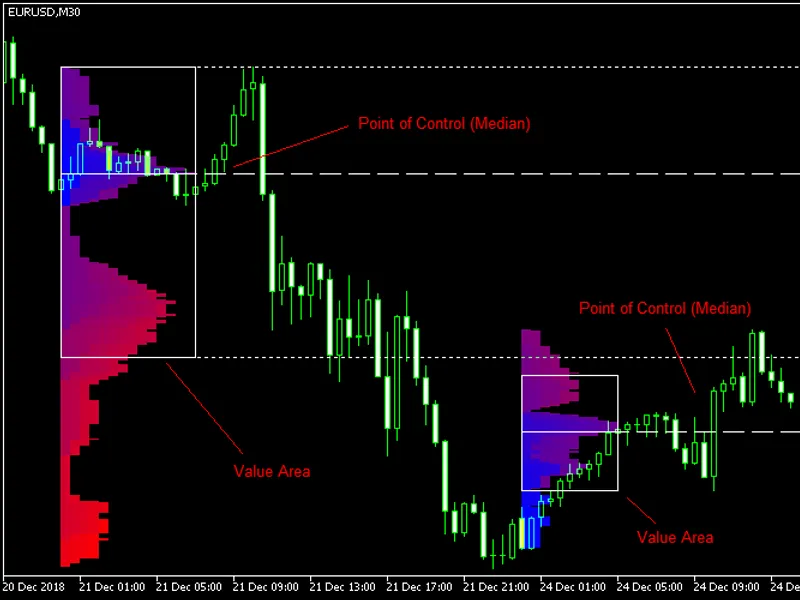
Market Profile MetaTrader indicator
— is a classic Market Profile implementation that can show the price density over time, outlining the most important price levels, value area, and control value of a given trading session. This indicator can be attached to timeframes between M1 and D1 and will show the Market Profile for daily, weekly, monthly, or even intraday sessions. Lower timeframes offer higher precision. Higher timeframes are recommended for better visibility. It is also possible to use a free-draw rectangle session to create a custom market profile on any timeframe. Six different color schemes are available to draw the profile's blocks. Drawing profiles as a plain color histogram is also possible. Alternatively, you may choose to color the profile based on bullish/bearish bars. This indicator is based on bare price action and does not use any standard indicators. It is available for MetaTrader 4, MetaTrader 5
Input parameters Main
Session
(default = Daily) — trading session for market profile: Daily, Weekly, Monthly, Intraday, and Rectangle. For a rectangle session to get calculated, a rectangle chart object with the name starting with MPR should be added to the chart. Pressing 'r' on the keyboard will add a properly named rectangle object automatically.
StartFromDate
(default = __DATE__) — if
StartFromCurrentSession
is false, then the indicator will start drawing profiles from this date. It draws to the past. For example, if you set it 2018-01-20 and
SessionsToCount
is 2, then it will draw the profiles for 2018-01-20 and 2018-01-19.
StartFromCurrentSession
(default = true) — if true, then the indicator starts drawing from today, else — from the date given in
StartFromDate
.
SessionsToCount
(default = 2) — for how many trading sessions to draw the market profiles.
SeamlessScrollingMode
(default = false) — if true, the
StartFromDate
and
StartFromCurrentSession
parameters are ignored; the sessions are calculated and displayed starting from the current chart position's rightmost bar. This allows scrolling back in time indefinitely to view past sessions.
EnableDevelopingPOC
(default = false) — if true, multiple horizontal lines will be drawn to depict how the Point of Control developed through the session.
EnableDevelopingVAHVAL
(default = false) — if true, multiple horizontal lines will be drawn to depict how the Value Area High and Value Area Low developed through the session.
ValueAreaPercentage
(default = 70) — a percentage share of the session's TPOs to include in the Value Area.