Easy Trend Visualizer MT5
This professional-grade solution for MetaTrader 5 helps traders achieve greater efficiency in their daily workflow. This technical indicator acts as a specialized analysis tool designed to visualize market data. It helps traders identify emerging trends, momentum shifts, and key support or resistance levels by plotting statistical calculations directly onto price charts.
How to Setup and Use Easy Trend Visualizer MT5
1. Installation: Place your file in the MQL/Indicators folder via "Open Data Folder" and restart your terminal.
2. Loading: Find the indicator in the Navigator, drag it onto your chart, and configure the input parameters in the popup window.
3. Customization: Press Ctrl+I to open the indicator list, select your tool, and click "Properties" to change colors, levels, or visual styles.
4. Updating: Replace the old file in the Indicators folder with the new version and restart the platform to apply changes.
Frequently Asked Questions
Q: Why is my indicator not showing? A: Verify the file is in the MQL/Indicators folder, or try right-clicking the "Indicators" tree in the Navigator and clicking "Refresh."
Q: Do custom indicators slow down the platform? A: Too many complex indicators can impact performance; remove unused ones via the "Indicator List" (Ctrl+I).
Q: Can I use MT4 indicators on MT5? A: No, MQL4 and MQL5 are distinct languages; ensure the indicator is compiled specifically for your platform version.
Description & Settings
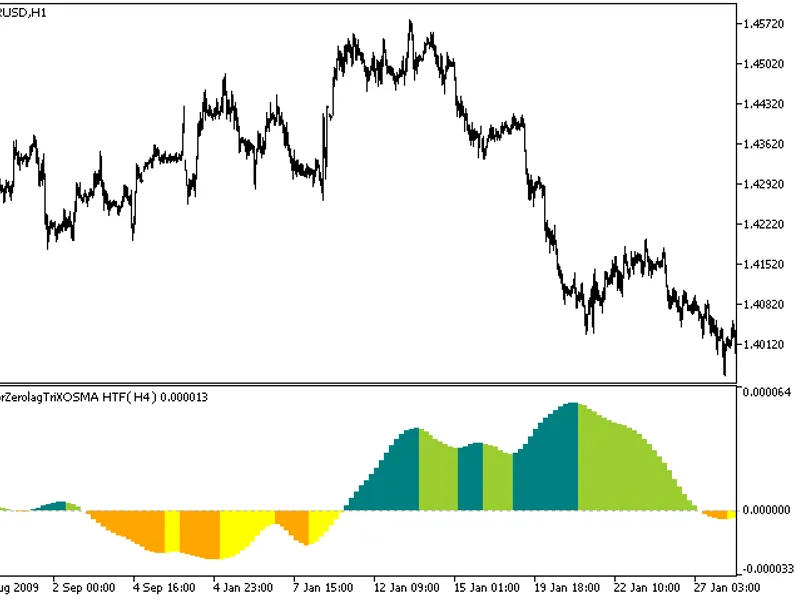
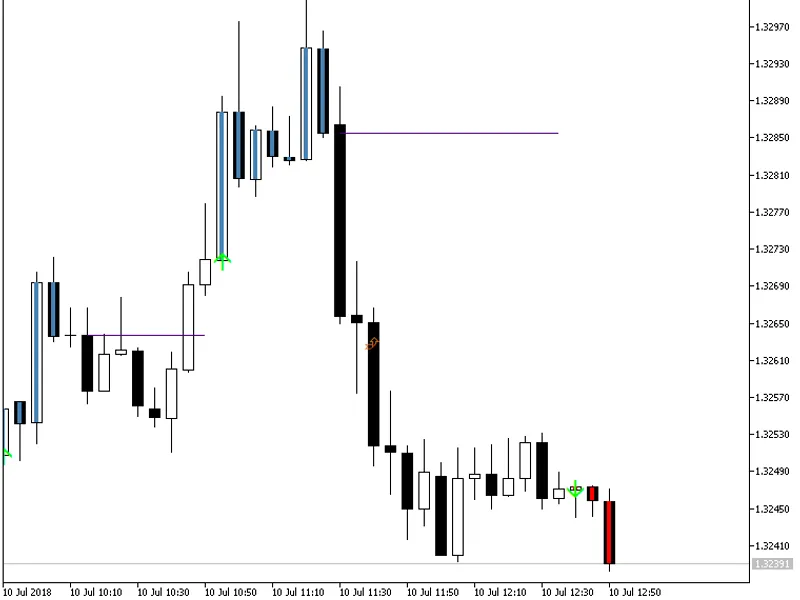
Easy Trend Visualizer
is a MetaTrader indicator that does exactly what its name says. It shows where the trend begins, where it ends, and where there is no trend at all. It is based on standard MetaTrader ADX (Average Direction Movement Index) indicators and works quite fast. Easy Trend Visualizer displays itself in the main chart window. It offers a range of alerts: horizontal line appears, horizontal line cross, arrow up, arrow down, previous horizontal line cross (PHLC). Available for MT4 and MT5 platforms.
Input parameters
ADXperiod1
(default = 10) — period of the first ADX indicator.
ADXperiod2
(default = 14) — period of the second ADX indicator.
ADXperiod3
(default = 20) — period of the third ADX indicator.
UseAlertHorizontalLine
(default = false) — issue a MetaTrader alert on horizontal line start.
UseAlertUpDownArrows
(default = false) — issue a MetaTrader alert when an up or down arrow appears.
UseAlertHorizontalLineCrossCurrent
(default = false) — issue a MetaTrader alert when a candle crosses the current horizontal line.
UseAlertHorizontalLineCrossPrevious
(default = false) — issue a MetaTrader alert when a candle crosses one of the previous horizontal lines.
NumberPHLtoTrack
(default = 0) — the number of previous horizontal lines to track for alert purposes. An alert will be issued when the price crosses one of the previous horizontal lines and closes above or below it.
IgnorePHLShorterThan
(default = 2) — the minimum length for the previous horizontal line to count it for for alert purposes. Lines with the length of 1 are not visible on the chart and will confuse you with unimportant alerts.
PHLC_Arrow_Color
(default = clrChocolate) — the color for the previous horizontal line cross alert arrows.
CHLC_Arrow_Color
(default = clrFireBrick) — the color for the current horizontal line cross alert arrows.
NativeAlerts
(default = true) — if true, native pop-up alerts will be generated by the indicator.
SendNotifications
(default = true) — if true, alerts will also be sent via push notifications to your mobile device. Notifications should be properly configured in MetaTrader via Tools->Options->Notifications.