Ehlers CG
This software component for MetaTrader 5 is built to enhance the capabilities of your trading environment. This technical indicator acts as a specialized analysis tool designed to visualize market data. It helps traders identify emerging trends, momentum shifts, and key support or resistance levels by plotting statistical calculations directly onto price charts.
How to Setup and Use Ehlers CG
1. Installation: Place your file in the MQL/Indicators folder via "Open Data Folder" and restart your terminal.
2. Loading: Find the indicator in the Navigator, drag it onto your chart, and configure the input parameters in the popup window.
3. Customization: Press Ctrl+I to open the indicator list, select your tool, and click "Properties" to change colors, levels, or visual styles.
4. Updating: Replace the old file in the Indicators folder with the new version and restart the platform to apply changes.
Frequently Asked Questions
Q: Why is my indicator not showing? A: Verify the file is in the MQL/Indicators folder, or try right-clicking the "Indicators" tree in the Navigator and clicking "Refresh."
Q: Do custom indicators slow down the platform? A: Too many complex indicators can impact performance; remove unused ones via the "Indicator List" (Ctrl+I).
Q: Can I use MT4 indicators on MT5? A: No, MQL4 and MQL5 are distinct languages; ensure the indicator is compiled specifically for your platform version.
Description & Settings
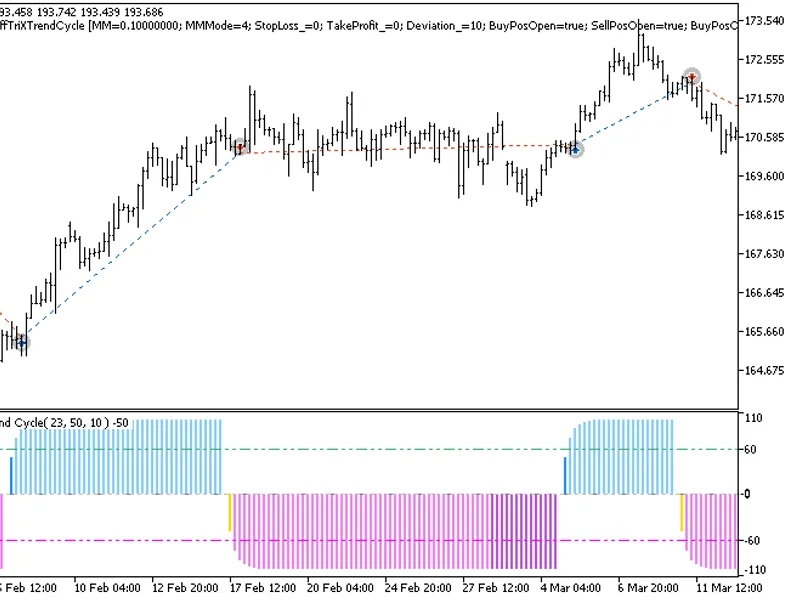
Ehler's Center of Gravity indicator is FIRfilter by John Ehlers applied to a price. It is the result of Ehlers' analysis of adaptive filters. "Gravity center" has zero lag that enables accurate detection of reversal points.
It has one configurable parameter:
Period
- calculation period
Interpretation:
Intersection of the main and signal lines.
Crossing at overbought/oversold level.
Since the indicator has no fixed levels, search for the new overbought level is reduced to observing the previous peak: if the indicator has formed a new peak that is higher than the previous one, we can assume that the asset is overbought, and it is time to sell at the downward intersection of the indicator lines. Search for the new oversold level is reduced to observing the previous bottom: if the indicator has formed a new bottom that is lower than the previous one, we can assume that the asset is oversold, and it is time to buy at the upward intersection of the indicator lines.
Divergences.
Along with a simple signal detection method (intersection of the main and signal lines), the indicator also works by divergence signals.