Didi Needles - with MA Threshold Diff Filtering
This tool for MetaTrader 5 is specifically engineered to streamline your trading operations. This technical indicator acts as a specialized analysis tool designed to visualize market data. It helps traders identify emerging trends, momentum shifts, and key support or resistance levels by plotting statistical calculations directly onto price charts.
How to Setup and Use Didi Needles - with MA Threshold Diff Filtering
1. Installation: Place your file in the MQL/Indicators folder via "Open Data Folder" and restart your terminal.
2. Loading: Find the indicator in the Navigator, drag it onto your chart, and configure the input parameters in the popup window.
3. Customization: Press Ctrl+I to open the indicator list, select your tool, and click "Properties" to change colors, levels, or visual styles.
4. Updating: Replace the old file in the Indicators folder with the new version and restart the platform to apply changes.
Frequently Asked Questions
Q: Why is my indicator not showing? A: Verify the file is in the MQL/Indicators folder, or try right-clicking the "Indicators" tree in the Navigator and clicking "Refresh."
Q: Do custom indicators slow down the platform? A: Too many complex indicators can impact performance; remove unused ones via the "Indicator List" (Ctrl+I).
Q: Can I use MT4 indicators on MT5? A: No, MQL4 and MQL5 are distinct languages; ensure the indicator is compiled specifically for your platform version.
Description & Settings
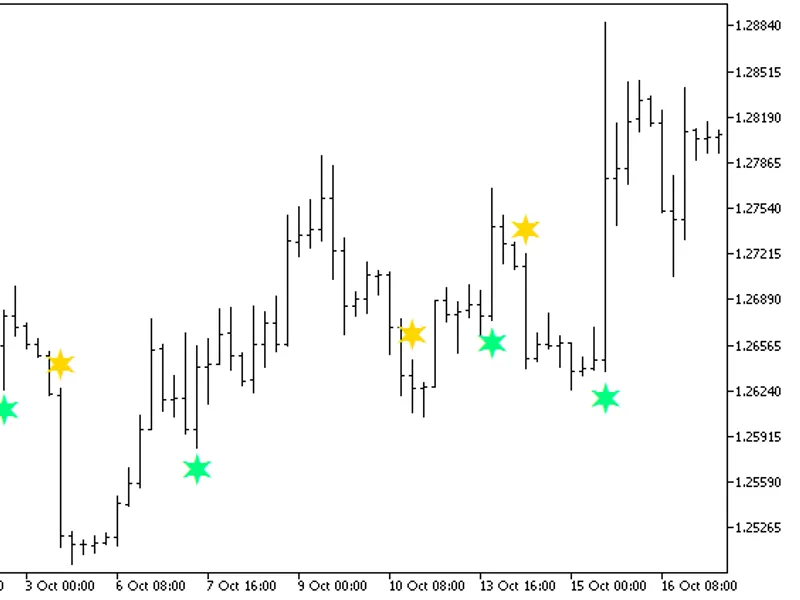
To also avoid firing up a signal on a weak trend, it was added to the indicator the ability to set a threshold considering the "inclination" of the "crossover". If the threshold is surpassed, a BUY/SELL signal is fired up in one of the 2 buffers (bufferBuy/bufferSell). You can check on the code that those signals are currently using the low[] and high[] values of the current candle. You can play with it using, let's say, Ask/Bid price in case if you are testing this in a pluggable EA.
Since there are several markets - using points, prices, etc - the "inclination" calculation is just a percentage value of the difference between the 3MA and the 20MA. And, to discover what is the best threshold for the Symbol, it was added an additional buffer (bufferDiff) to enable the user, using the Data Window, to check with the mouse every candle and see the calculation live on the Chart/Data Window:
So, for each Symbol the user can put the studied minimum threshold on the indicator input to filter out the BUY/SELL signals.
Hope this indicator can help traders all over the world.
As always, play a lot, using other parameters, timeframes, confirmation indicators, Price Action techniques, etc.
Live Long and Prosper.
;)
=== UPDATE (Jan/2018) - v1.1 - corrected a little bug in the code (damn comma!) Thanks @GuilhermeAdams ;) ===