Hammer Indicator
This is a powerful addition to your MetaTrader 5 toolkit designed to optimize market analysis and performance. This technical indicator acts as a specialized analysis tool designed to visualize market data. It helps traders identify emerging trends, momentum shifts, and key support or resistance levels by plotting statistical calculations directly onto price charts.
How to Setup and Use Hammer Indicator
1. Installation: Place your file in the MQL/Indicators folder via "Open Data Folder" and restart your terminal.
2. Loading: Find the indicator in the Navigator, drag it onto your chart, and configure the input parameters in the popup window.
3. Customization: Press Ctrl+I to open the indicator list, select your tool, and click "Properties" to change colors, levels, or visual styles.
4. Updating: Replace the old file in the Indicators folder with the new version and restart the platform to apply changes.
Frequently Asked Questions
Q: Why is my indicator not showing? A: Verify the file is in the MQL/Indicators folder, or try right-clicking the "Indicators" tree in the Navigator and clicking "Refresh."
Q: Do custom indicators slow down the platform? A: Too many complex indicators can impact performance; remove unused ones via the "Indicator List" (Ctrl+I).
Q: Can I use MT4 indicators on MT5? A: No, MQL4 and MQL5 are distinct languages; ensure the indicator is compiled specifically for your platform version.
Description & Settings
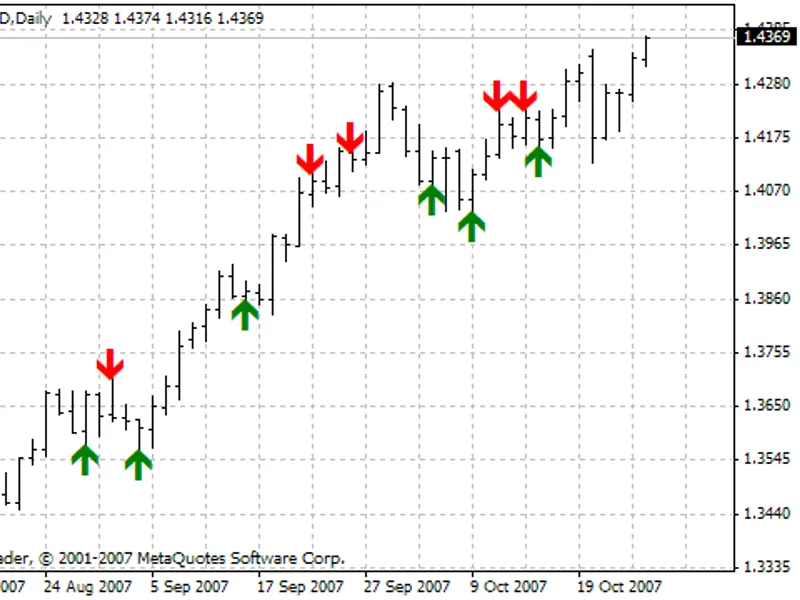
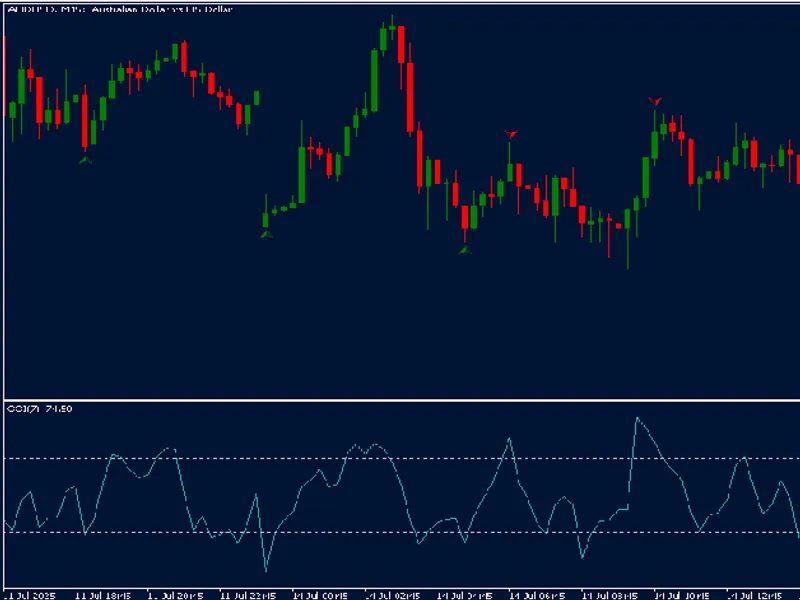
The Hammer Indicator identifies key candlestick formations, specifically green and red hammers as well as inverted hammers, on a MetaTrader 5 chart. It is designed to highlight potential reversal points in price by analyzing the candlestick structure on each bar. A hammer is generally characterized by a small body and a long lower wick, indicating potential buying pressure after a downtrend. The inverted hammer, in contrast, has a long upper wick and may suggest a possible reversal following an uptrend.
This indicator calculates the size and ratio of candlestick wicks and bodies to detect these patterns, using three main customizable parameters:
MaxRatioShortWick
: Sets the maximum ratio for the short wick relative to the full candlestick, filtering for patterns with minimal top wicks.
MinRatioLongWick
: Defines the minimum ratio for the long wick, ensuring that the detected patterns have significant wick lengths compared to the candlestick body.
MinCandleSize
: Specifies the minimum size of the candlestick required to qualify as a hammer or inverted hammer pattern.
Once a pattern is identified, the indicator will display an arrow in a designated color (green or red) on the chart, placed near the highest or lowest price of the candlestick, depending on the direction of the pattern. The functions within the code handle the creation and positioning of these graphical objects, as well as cleaning up the objects when the indicator is removed from the chart.
This indicator is suitable for traders looking to spot potential reversals, and its parameters can be tailored to suit different timeframes and market conditions. It is a versatile tool that can complement various trading strategies by providing early visual cues for potential price changes.