Bounce Strength Indicator
This is a powerful addition to your MetaTrader 4 toolkit designed to optimize market analysis and performance. This technical indicator acts as a specialized analysis tool designed to visualize market data. It helps traders identify emerging trends, momentum shifts, and key support or resistance levels by plotting statistical calculations directly onto price charts.
How to Setup and Use Bounce Strength Indicator
1. Installation: Place your file in the MQL/Indicators folder via "Open Data Folder" and restart your terminal.
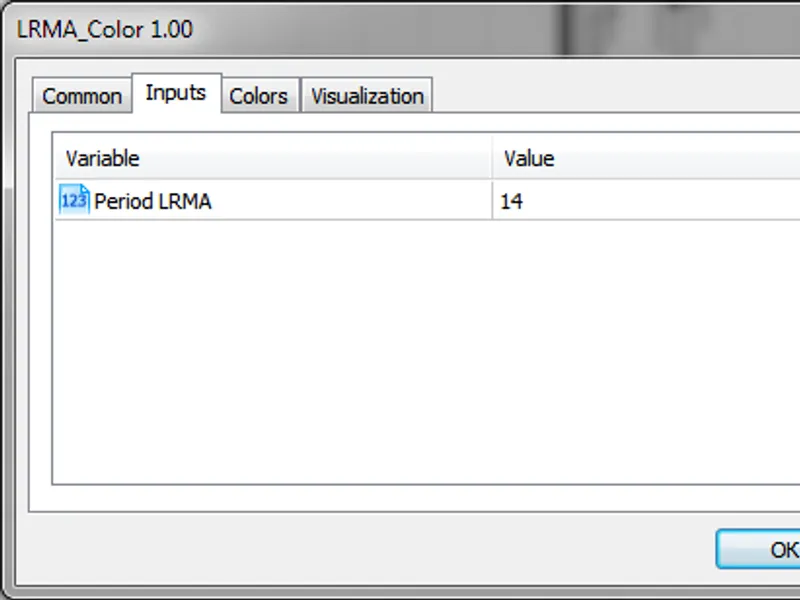
2. Loading: Find the indicator in the Navigator, drag it onto your chart, and configure the input parameters in the popup window.
3. Customization: Press Ctrl+I to open the indicator list, select your tool, and click "Properties" to change colors, levels, or visual styles.
4. Updating: Replace the old file in the Indicators folder with the new version and restart the platform to apply changes.
Frequently Asked Questions
Q: Why is my indicator not showing? A: Verify the file is in the MQL/Indicators folder, or try right-clicking the "Indicators" tree in the Navigator and clicking "Refresh."
Q: Do custom indicators slow down the platform? A: Too many complex indicators can impact performance; remove unused ones via the "Indicator List" (Ctrl+I).
Q: Can I use MT4 indicators on MT5? A: No, MQL4 and MQL5 are distinct languages; ensure the indicator is compiled specifically for your platform version.
Description & Settings
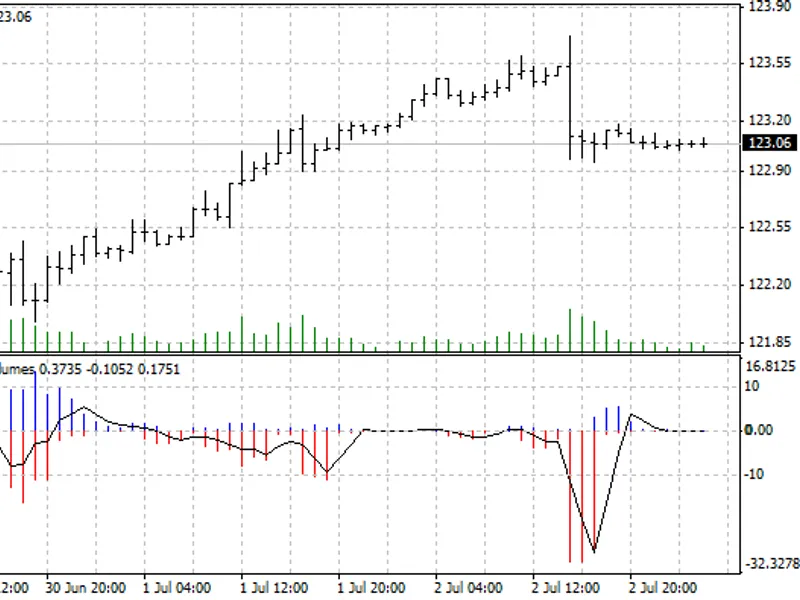
Bounce Strength Indicator (BSI) shows the strength of bounce according to the Wyckoff method.
After a move higher, the stock moves into a flat consolidation with a clear support level. Chartists should watch action closely as prices approach support. A high volume surge off support, also known as a springboard, is the first sign that the bigger uptrend is set to continue and a consolidation breakout is imminent.
How to measure the strength of bounce?
Strength of bounce up from lows:
Strength of bounce down from highs:
My measuring method means the following:
The greater the rise from lower position, the stronger the buying pressure.
The greater the fall from higher position, the stronger the selling pressure.
This idea is simple, but it can become a leading indicator of the range breakout. It will work only within range.
Display:
plus histogram — shows the bounce strength up from lows;
minus histogram — shows the bounce strength down from highs;
middle line — average of difference between plus/minus.