Overlay Chart Modified to not repaint on each bar
This software component for MetaTrader 4 is built to enhance the capabilities of your trading environment. This technical indicator acts as a specialized analysis tool designed to visualize market data. It helps traders identify emerging trends, momentum shifts, and key support or resistance levels by plotting statistical calculations directly onto price charts.
How to Setup and Use Overlay Chart Modified to not repaint on each bar
1. Installation: Place your file in the MQL/Indicators folder via "Open Data Folder" and restart your terminal.
2. Loading: Find the indicator in the Navigator, drag it onto your chart, and configure the input parameters in the popup window.
3. Customization: Press Ctrl+I to open the indicator list, select your tool, and click "Properties" to change colors, levels, or visual styles.
4. Updating: Replace the old file in the Indicators folder with the new version and restart the platform to apply changes.
Frequently Asked Questions
Q: Why is my indicator not showing? A: Verify the file is in the MQL/Indicators folder, or try right-clicking the "Indicators" tree in the Navigator and clicking "Refresh."
Q: Do custom indicators slow down the platform? A: Too many complex indicators can impact performance; remove unused ones via the "Indicator List" (Ctrl+I).
Q: Can I use MT4 indicators on MT5? A: No, MQL4 and MQL5 are distinct languages; ensure the indicator is compiled specifically for your platform version.
Description & Settings
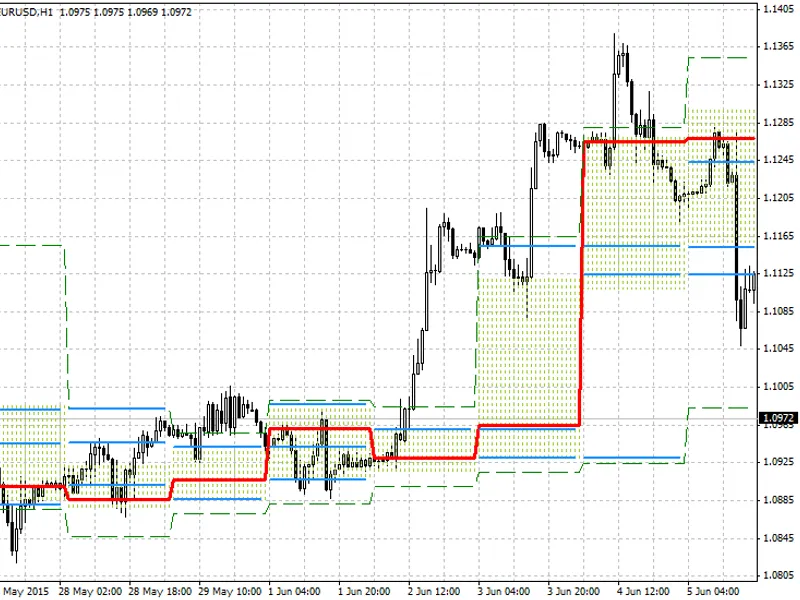
image: Modified Overlay Chart USDJPY vs USDCHF (4hr chart)
Function
The Original Overlay Chart is used to have two currencies or 2 assets on 1 chart.
The relative price of the one currency can be seen in terms on the other currency.For example, on the EURUSD chart, using this indicator, The USDCHF could be added and the USDCHF price will be shown in terms of EURUSD price.
Use
This could be useful for strategies that depend on the convergence or divergence of 2 currencies or assets. Some people informally refer to this as 'correlation' or 'arbitrage' or more formally 'co-integration' strategies or 'relative value'.
Changes/updates/improvements
The Original indicator will re-center its calculation on every bar, and hence the price will keep shifting up and down and so the historical relative values do not remain constant. This indicator was modified so that the 'center' or initial relative reference point stays fixed and does not update each bar. It will only update the initial center point (Re-initialize) when the indicator is reloaded or settings are changed. (The indicator does however show the changes of the current prices on the same chart, just to clarify).
This indicator also paints for history far back, while the original does not. I may have also changed one or two other things in the original code, you can find the .
InputsThe SET CENTER input is which bar back in the history the indicator should use to be the fixed initial point to compare the 2 currencies or assets.