CR T Indicator(MT F) : Explorer
This is a powerful addition to your MetaTrader 5 toolkit designed to optimize market analysis and performance. This technical indicator acts as a specialized analysis tool designed to visualize market data. It helps traders identify emerging trends, momentum shifts, and key support or resistance levels by plotting statistical calculations directly onto price charts.
How to Setup and Use CR T Indicator(MT F) : Explorer
1. Installation: Place your file in the MQL/Indicators folder via "Open Data Folder" and restart your terminal.
2. Loading: Find the indicator in the Navigator, drag it onto your chart, and configure the input parameters in the popup window.
3. Customization: Press Ctrl+I to open the indicator list, select your tool, and click "Properties" to change colors, levels, or visual styles.
4. Updating: Replace the old file in the Indicators folder with the new version and restart the platform to apply changes.
Frequently Asked Questions
Q: Why is my indicator not showing? A: Verify the file is in the MQL/Indicators folder, or try right-clicking the "Indicators" tree in the Navigator and clicking "Refresh."
Q: Do custom indicators slow down the platform? A: Too many complex indicators can impact performance; remove unused ones via the "Indicator List" (Ctrl+I).
Q: Can I use MT4 indicators on MT5? A: No, MQL4 and MQL5 are distinct languages; ensure the indicator is compiled specifically for your platform version.
Description & Settings
CRT Indicator (MTF): Explorer
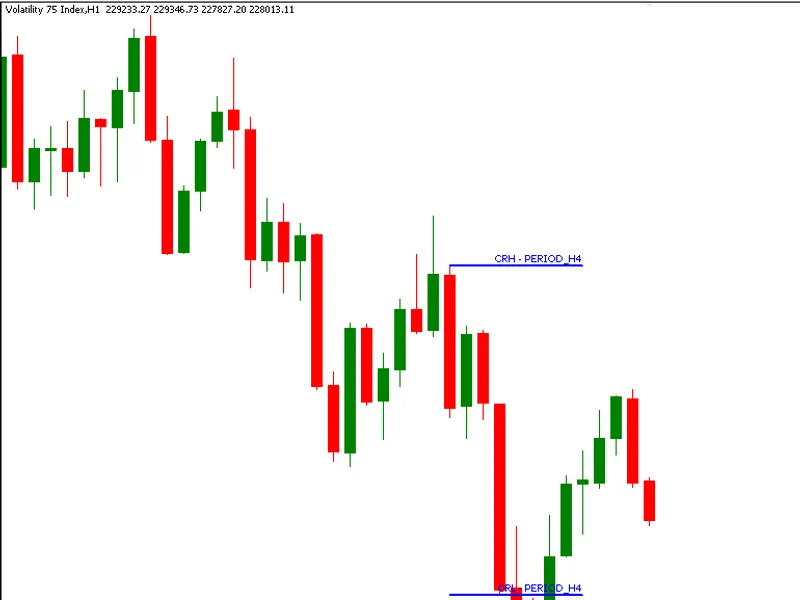
— From Single View to Market Structure Awareness In the , we engineered a clean and focused single-timeframe CRT model, isolated, precise, and effective within its own scope. But markets are rarely that one-dimensional. This codebase advances that foundation into a multi-timeframe (MTF) exploration tool, designed to bridge the gap between higher timeframe intent and lower timeframe execution. The CRT Indicator (MTF): Explorer introduces a structured way to project higher timeframe CRT formations directly onto lower timeframe charts, giving you immediate visual context of where price is reacting within a broader narrative. At its core, this implementation listens to a user-defined higher timeframe (HTF), detects textbook CRT conditions, and maps those zones using Fibonacci objects onto the active lower timeframe (LTF). The result is a clean overlay of CRH (CRT High) and CRL (CRT Low), allowing you to observe how microstructure evolves around macro-defined levels, without switching charts or losing flow. What makes this build particularly elegant is its minimalist engineering. In under 130 lines of MQL5, it leverages the standard library’s to construct dynamic, color-coded CRT zones, updated only when a new HTF bar forms. This ensures both efficiency and accuracy, avoiding redundant calculations while maintaining real-time responsiveness.
Key Highlights
True Multi-Timeframe Bridging
Seamlessly integrates HTF logic into LTF visualization, enabling top-down analysis within a single chart environment.
2.
Event-Driven HTF Synchronization Uses precise new-bar detection on the higher timeframe to ensure CRT evaluation occurs only when structurally relevant. 3.
Textbook CRT Validation Logic
Encapsulates both bullish and bearish CRT conditions using strict price-action rules, preserving model integrity. 4.
Fibonacci-Based Level Projection
Utilizes to draw CRH and CRL levels with clarity, labeling, and directional color context.
What You’ll Learn
How to architect a multi-timeframe indicator in MQL5 without introducing lag or complexity
Techniques for synchronizing HTF data inside an LTF execution loop
Practical use of standard library chart objects () for structured visualization
Designing event-driven logic (new bar detection) for cleaner and more deterministic indicator behavior
Translating abstract price models (like CRT) into visual, decision-support tools
This isn’t just an upgrade, it’s a shift in perspective.