Corrected T3 - EM A deviations
This is a powerful addition to your MetaTrader 5 toolkit designed to optimize market analysis and performance. This technical indicator acts as a specialized analysis tool designed to visualize market data. It helps traders identify emerging trends, momentum shifts, and key support or resistance levels by plotting statistical calculations directly onto price charts.
How to Setup and Use Corrected T3 - EM A deviations
1. Installation: Place your file in the MQL/Indicators folder via "Open Data Folder" and restart your terminal.
2. Loading: Find the indicator in the Navigator, drag it onto your chart, and configure the input parameters in the popup window.
3. Customization: Press Ctrl+I to open the indicator list, select your tool, and click "Properties" to change colors, levels, or visual styles.
4. Updating: Replace the old file in the Indicators folder with the new version and restart the platform to apply changes.
Frequently Asked Questions
Q: Why is my indicator not showing? A: Verify the file is in the MQL/Indicators folder, or try right-clicking the "Indicators" tree in the Navigator and clicking "Refresh."
Q: Do custom indicators slow down the platform? A: Too many complex indicators can impact performance; remove unused ones via the "Indicator List" (Ctrl+I).
Q: Can I use MT4 indicators on MT5? A: No, MQL4 and MQL5 are distinct languages; ensure the indicator is compiled specifically for your platform version.
Description & Settings
Origin of correcting algorithm :
Dr. Alexander Uhl invented a method that he used to filter the moving average and to check for signals. Originally it uses standard deviation as a measure to correct the averages values.
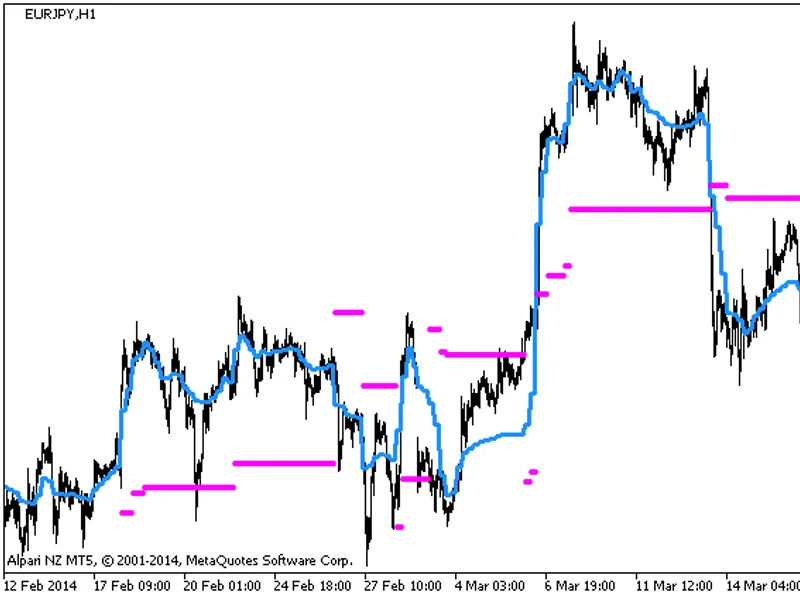
This indicator :
This indicator is using the modified "correcting" method. Instead of using standard deviation for calculation, it is using EMA deviation (originally published here : ) which results in two things.
the calculation of EMA deviation can be made to be much faster than the standard deviation and that results in more efficient code
a bit surprisingly, this way of "correcting" produces less signals then when standard deviation is used. That is a result of EMA deviation being more responsive to price changes and then the correcting is less sensitive to whipsaws. In any case experimenting is advised before using it in live trading
Usage :
You can use the change of color as signals