Extreme highs and lows with tick prices
This software component for MetaTrader 5 is built to enhance the capabilities of your trading environment. This technical indicator acts as a specialized analysis tool designed to visualize market data. It helps traders identify emerging trends, momentum shifts, and key support or resistance levels by plotting statistical calculations directly onto price charts.
How to Setup and Use Extreme highs and lows with tick prices
1. Installation: Place your file in the MQL/Indicators folder via "Open Data Folder" and restart your terminal.
2. Loading: Find the indicator in the Navigator, drag it onto your chart, and configure the input parameters in the popup window.
3. Customization: Press Ctrl+I to open the indicator list, select your tool, and click "Properties" to change colors, levels, or visual styles.
4. Updating: Replace the old file in the Indicators folder with the new version and restart the platform to apply changes.
Frequently Asked Questions
Q: Why is my indicator not showing? A: Verify the file is in the MQL/Indicators folder, or try right-clicking the "Indicators" tree in the Navigator and clicking "Refresh."
Q: Do custom indicators slow down the platform? A: Too many complex indicators can impact performance; remove unused ones via the "Indicator List" (Ctrl+I).
Q: Can I use MT4 indicators on MT5? A: No, MQL4 and MQL5 are distinct languages; ensure the indicator is compiled specifically for your platform version.
Description & Settings
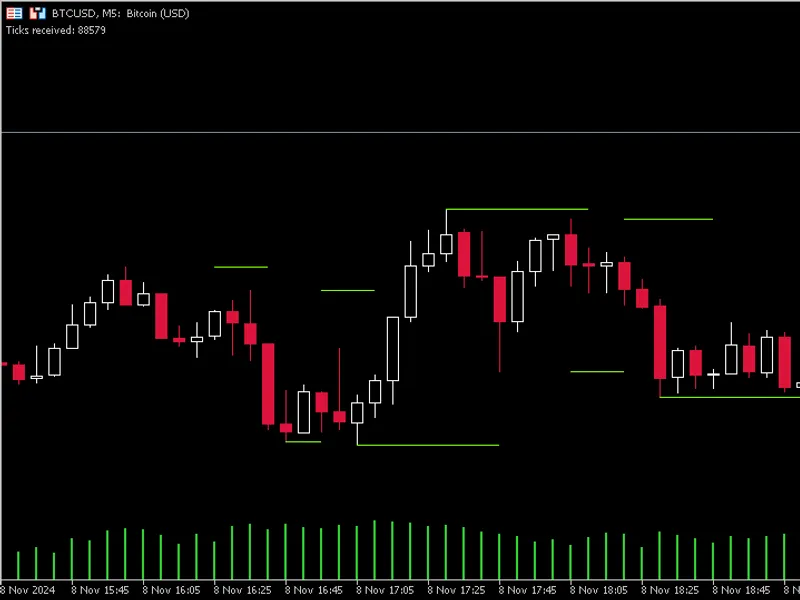
An indicator to mark extremums with lines. A period input is used to determine highest highs and lowest lows for that period. In this indicator, it's not only highs and lows (OHLC) which are used in the analysis, but also bid and ask prices from each bar. A lookback figure is used to limit the processing to a specific number of bars.
Another feature in this indicator is to not paint on break of structure areas (breaking of the current perceived higher high or lower low) by forcing sections of the lines to vanish during those periods. This way it will only display lines on actual support and resistance areas. That feature is controlled by an input, so if you prefer, it will display lines on the extreme prices as well as display sloping of the lines when the market is trending up or down.
----------------------------------------------------
- It uses an optimization where only the ticks from the current bar will be accounted for, and this will mean that the indicator can run seamlessly on higher timeframes
- Removed unneeded buffers