Gain/Loss Info MT5
This tool for MetaTrader 5 is specifically engineered to streamline your trading operations. This technical indicator acts as a specialized analysis tool designed to visualize market data. It helps traders identify emerging trends, momentum shifts, and key support or resistance levels by plotting statistical calculations directly onto price charts.
How to Setup and Use Gain/Loss Info MT5
1. Installation: Place your file in the MQL/Indicators folder via "Open Data Folder" and restart your terminal.
2. Loading: Find the indicator in the Navigator, drag it onto your chart, and configure the input parameters in the popup window.
3. Customization: Press Ctrl+I to open the indicator list, select your tool, and click "Properties" to change colors, levels, or visual styles.
4. Updating: Replace the old file in the Indicators folder with the new version and restart the platform to apply changes.
Frequently Asked Questions
Q: Why is my indicator not showing? A: Verify the file is in the MQL/Indicators folder, or try right-clicking the "Indicators" tree in the Navigator and clicking "Refresh."
Q: Do custom indicators slow down the platform? A: Too many complex indicators can impact performance; remove unused ones via the "Indicator List" (Ctrl+I).
Q: Can I use MT4 indicators on MT5? A: No, MQL4 and MQL5 are distinct languages; ensure the indicator is compiled specifically for your platform version.
Description & Settings
Gain/Loss Info MetaTrader indicator
— displays the gains and losses for all candles where the given threshold is surpassed. The values are calculated in points and percentage. The indicator can calculate gain/loss in two modes: plain candlestick Close and Open difference, and as difference between current Close and previous Close. You can set minimum change limits (for pips and percentage), change modes, and you can also control font color of the output numbers. The indicator is available for both MT4 and MT5.
Input parameters
PercentageLimit
(default = 1.0) — minimum threshold for the change to be displayed; in percentage points.
PointsLimit
(default = 1000) — minimum threshold for the change to be displayed; in points.
CloseToClose
(default = true) — if true, the indicator will compare current Close to previous Close; if false, it will compare current Close to current Open.
DisplayLossColor
(default = clrRed) — color of the negative price change display.
DisplayGainColor
(default = clrGreen) — color of the positive price change display.
MaxBars
(default = 100) — maximum number of bars to calculate the indicator on. The higher is the number the more lagging indicator becomes.
FontFace
(default = "Verdana") — the font face to use for display.
FontSize
(default = 10) — the font size to use for display.
ObjectPrefix
(default = "GLI-") — prefix for chart objects for compatibility with other indicators.
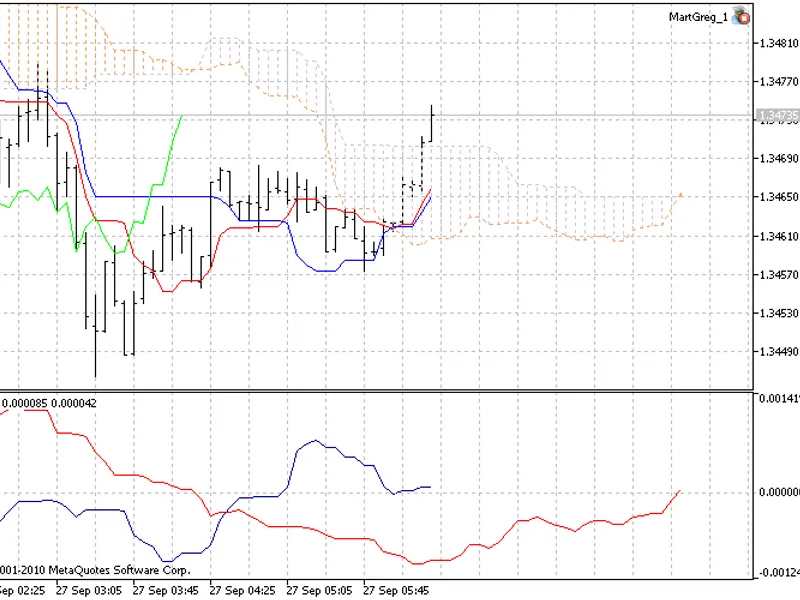
The chart above shows the example usage of the Gain/Loss Info indicator on GBP/USD @ W1. The percentage limit was set to 1.0% and pips limit was set to 1,500 pips. The calculation mode was set to "Close vs. previous Close." Points count for period is displayed below candles. Percentage change — above candles.
Obviously, it is nearly impossible to use this indicator to generate trading signals. Its main purpose is to simplify the analysis of the market situation and to make it easier to find some bullish and bearish patterns. Of course, you can still use the data about abnormally big changes as some sort of entry or exit signals.