Candle Replay Magnifier
This tool for MetaTrader 5 is specifically engineered to streamline your trading operations. This technical indicator acts as a specialized analysis tool designed to visualize market data. It helps traders identify emerging trends, momentum shifts, and key support or resistance levels by plotting statistical calculations directly onto price charts.
How to Setup and Use Candle Replay Magnifier
1. Installation: Place your file in the MQL/Indicators folder via "Open Data Folder" and restart your terminal.
2. Loading: Find the indicator in the Navigator, drag it onto your chart, and configure the input parameters in the popup window.
3. Customization: Press Ctrl+I to open the indicator list, select your tool, and click "Properties" to change colors, levels, or visual styles.
4. Updating: Replace the old file in the Indicators folder with the new version and restart the platform to apply changes.
Frequently Asked Questions
Q: Why is my indicator not showing? A: Verify the file is in the MQL/Indicators folder, or try right-clicking the "Indicators" tree in the Navigator and clicking "Refresh."
Q: Do custom indicators slow down the platform? A: Too many complex indicators can impact performance; remove unused ones via the "Indicator List" (Ctrl+I).
Q: Can I use MT4 indicators on MT5? A: No, MQL4 and MQL5 are distinct languages; ensure the indicator is compiled specifically for your platform version.
Description & Settings
Features:
Overlay candles from any past date directly onto the current chart.
Automatic adjustment of replay zone/magnifier to match live chart movement.
Dynamic tooltips showing:
Time.
Open, High, Low, Close.
Candle Range.
Bullish/Bearish direction.
Volume.
Customizable colors for bullish/bearish candles and zones.
Interactive zone for selecting and dragging overlay region.
Works on intraday timeframes (e.g. M1 to H1).
Parameters:
How to Use:
A simple step-by-step guide:
Attach the indicator to a chart (preferable intraday).
Select the
Replay Date
using input panel.
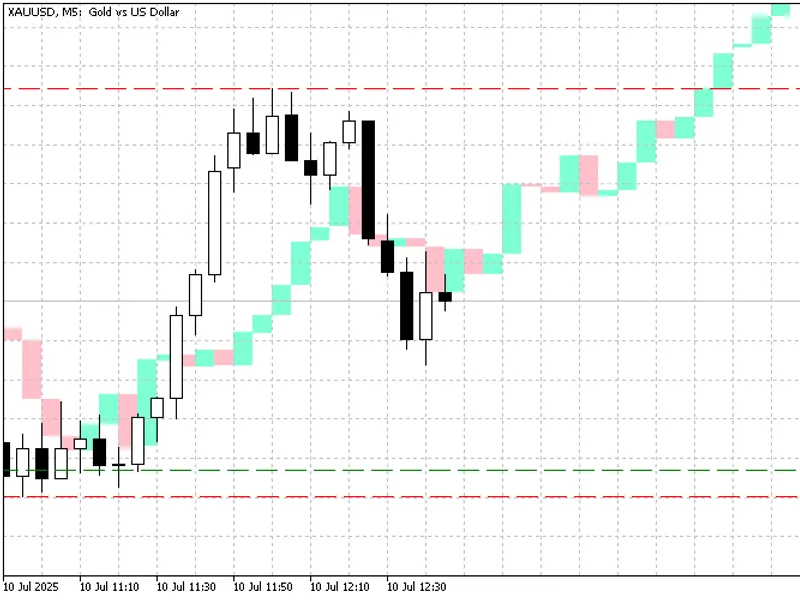
The indicator will draw a red "Main Zone" on your current chart.
A green "Replay Zone" will display historical candles mapped to the same relative position and size.
Hover over the replay bars to see candle details.
What's inside the Zones?
The
first candle
in the Main Zone (on the left) corresponds to the first candle from the selected
ReplayDate
.
The
current live candle
(on the right of the red zone) is aligned with the
last candle
of the green Replay Zone.
This lets you easily see:
"How did the market behave at this position last time?".
"Are we repeating a similar pattern?".
What's around my current Candlestick?
The
current candlestick
(last bar in the red Main Zone) corresponds exactly to the
last candle
in the green Replay Zone - they are aligned in both
time position
and
open price
.
The
first candle on the left
of the Main Zone is matched to the
first candle
of the Replay Zone (from the selected ReplayDate).
The
last (current) candle
of the Main Zone is matched to the
last candle
from the Replay Zone - their
opening prices are identica
l for comparison.
This lets you answer:
"What did price do next the last time we were at the same level and time of day?".
Notes and Limitations:
Zone Range:
Large replay ranges may impact performance on low-end devices.
No Wicks:
Only candle bodies are drawn, upper and lower shadows are not shown.
No buffers:
This indicator uses only chart objects (rectangles), not indicator buffers.
Redraws every new bar:
The full replay zone is
re-rendered
on each new tick or bar, which is not optimized for performance.
Market Closed on Replay date:
If the market was closed on the selected ReplayDate,
no candles will appear
.
Replay Offset Risk:
If some bars are missing on the replay date, the green replay zone may
misalign
, and the current candle's open price may not match the replay candles open price.
Only intraday timeframes supported:
This tool is designed for intraday use (below daily timeframe). Not intended for D1/W1/M1.
Screenshots:
Conclusion:Whether you're a pattern trader, scalper, or just want to visually compare market behavior, this tool adds a new perspective to your analysis. Give it a try and let me know what you think!