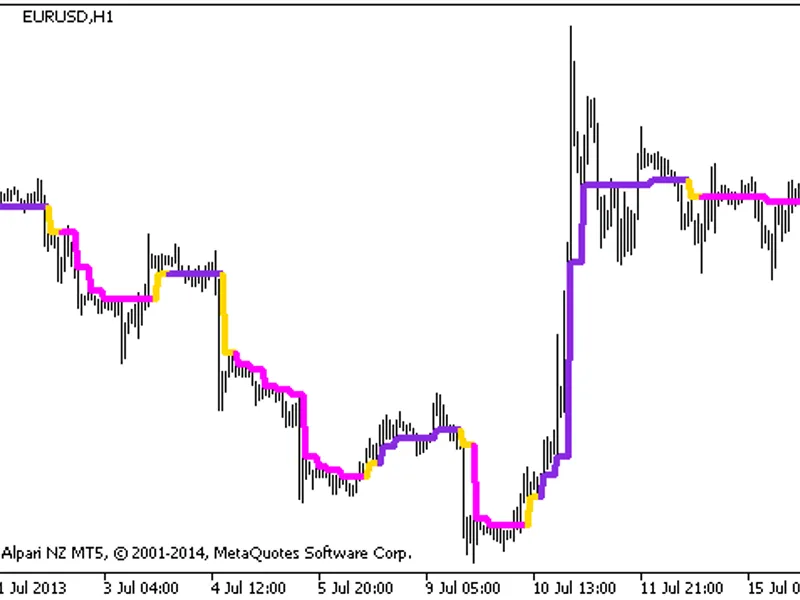
Candle Body Ratio
This is a powerful addition to your MetaTrader 5 toolkit designed to optimize market analysis and performance. This technical indicator acts as a specialized analysis tool designed to visualize market data. It helps traders identify emerging trends, momentum shifts, and key support or resistance levels by plotting statistical calculations directly onto price charts.
How to Setup and Use Candle Body Ratio
1. Installation: Place your file in the MQL/Indicators folder via "Open Data Folder" and restart your terminal.
2. Loading: Find the indicator in the Navigator, drag it onto your chart, and configure the input parameters in the popup window.
3. Customization: Press Ctrl+I to open the indicator list, select your tool, and click "Properties" to change colors, levels, or visual styles.
4. Updating: Replace the old file in the Indicators folder with the new version and restart the platform to apply changes.
Frequently Asked Questions
Q: Why is my indicator not showing? A: Verify the file is in the MQL/Indicators folder, or try right-clicking the "Indicators" tree in the Navigator and clicking "Refresh."
Q: Do custom indicators slow down the platform? A: Too many complex indicators can impact performance; remove unused ones via the "Indicator List" (Ctrl+I).
Q: Can I use MT4 indicators on MT5? A: No, MQL4 and MQL5 are distinct languages; ensure the indicator is compiled specifically for your platform version.
Description & Settings
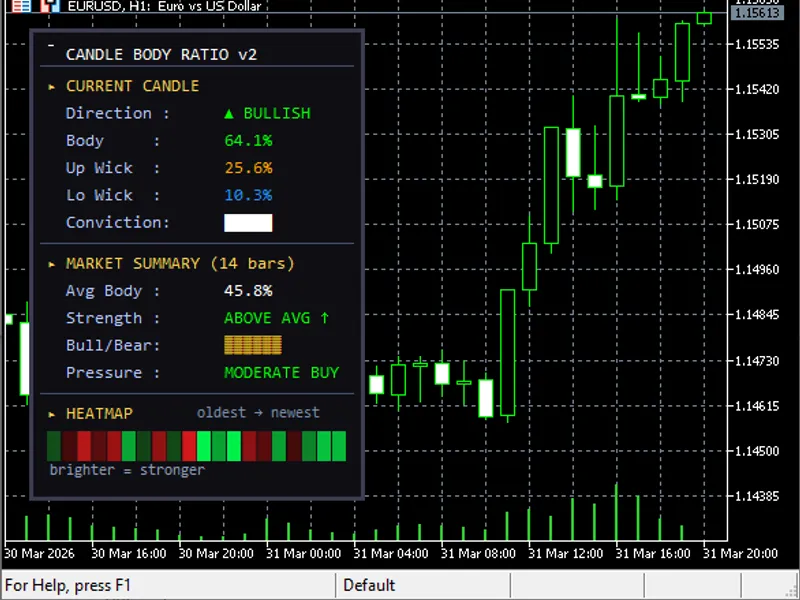
This indicator measures the body-to-wick ratio of each candle and displays a floating dashboard directly on the chart. It tells you at a glance how strong or weak the current candle is, what the average body ratio looks like over a chosen lookback period, and whether bulls or bears have been dominant. A color-coded heatmap strip shows the last N candles ranked by body strength, where brighter color means stronger conviction.
The panel is divided into three sections. The first section shows the current candle with its body percentage, upper wick, lower wick, and a conviction rating. The second section shows a market summary over the lookback period including average body ratio, a bull vs bear dominance bar, and a pressure label. The third section is the heatmap strip showing recent candles colored from dark (weak) to bright (strong), with the oldest candle on the left and the newest on the right.
All visual elements are fully customizable through input parameters. You can adjust colors, thresholds, font size, panel position, and lookback period. An optional alert fires when the current candle meets the strong body threshold.
Input Parameters