Fisher Indicator MT5
This is a powerful addition to your MetaTrader 5 toolkit designed to optimize market analysis and performance. This technical indicator acts as a specialized analysis tool designed to visualize market data. It helps traders identify emerging trends, momentum shifts, and key support or resistance levels by plotting statistical calculations directly onto price charts.
How to Setup and Use Fisher Indicator MT5
1. Installation: Place your file in the MQL/Indicators folder via "Open Data Folder" and restart your terminal.
2. Loading: Find the indicator in the Navigator, drag it onto your chart, and configure the input parameters in the popup window.
3. Customization: Press Ctrl+I to open the indicator list, select your tool, and click "Properties" to change colors, levels, or visual styles.
4. Updating: Replace the old file in the Indicators folder with the new version and restart the platform to apply changes.
Frequently Asked Questions
Q: Why is my indicator not showing? A: Verify the file is in the MQL/Indicators folder, or try right-clicking the "Indicators" tree in the Navigator and clicking "Refresh."
Q: Do custom indicators slow down the platform? A: Too many complex indicators can impact performance; remove unused ones via the "Indicator List" (Ctrl+I).
Q: Can I use MT4 indicators on MT5? A: No, MQL4 and MQL5 are distinct languages; ensure the indicator is compiled specifically for your platform version.
Description & Settings
Fisher MetaTrader indicator
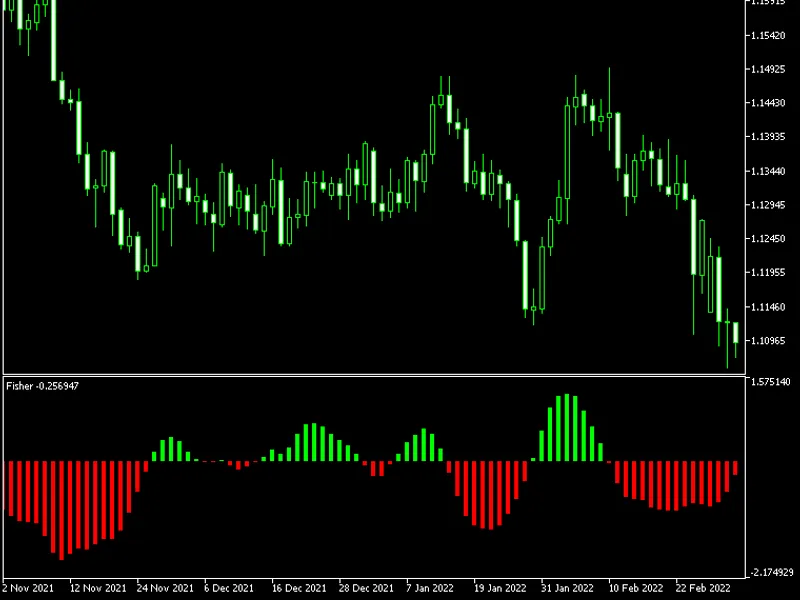
— is quite a simple histogram indicator that detects the trend's direction and strength and signals about trend changes. It doesn't use any standard MT4/MT5 indicators in its code. Fisher bases its calculations on the maximum and minimum price levels from the previous periods, applying some advanced math calculations to the relations between the current price and the max/min prices. The indicator is available for both MT4 and MT5. This is a "repainting" indicator — it recalculates previous bars when a new bar arrives.
Input parameters
Period
(default = 10) — the period in bars, on which to calculate the maximum and minimum. The higher is the value the fewer false trend change signals occur but the more this indicator lags. On the chart example above, you see that the upward trends are marked with the green histogram lines, while the downward trends are marked with the red lines. It is easy to trade with this indicator. You can close short positions and go long when the lines' color changes from red to green. You can close long positions and go short when the lines change from green to red. With the default period setting (10), it was very accurate on EUR/USD H1 chart. The problem is, you have to wait a few bars before acting on a signal because it may change due to repainting.