wd. Range MA C D
This professional-grade solution for MetaTrader 5 helps traders achieve greater efficiency in their daily workflow. This technical indicator acts as a specialized analysis tool designed to visualize market data. It helps traders identify emerging trends, momentum shifts, and key support or resistance levels by plotting statistical calculations directly onto price charts.
How to Setup and Use wd. Range MA C D
1. Installation: Place your file in the MQL/Indicators folder via "Open Data Folder" and restart your terminal.
2. Loading: Find the indicator in the Navigator, drag it onto your chart, and configure the input parameters in the popup window.
3. Customization: Press Ctrl+I to open the indicator list, select your tool, and click "Properties" to change colors, levels, or visual styles.
4. Updating: Replace the old file in the Indicators folder with the new version and restart the platform to apply changes.
Frequently Asked Questions
Q: Why is my indicator not showing? A: Verify the file is in the MQL/Indicators folder, or try right-clicking the "Indicators" tree in the Navigator and clicking "Refresh."
Q: Do custom indicators slow down the platform? A: Too many complex indicators can impact performance; remove unused ones via the "Indicator List" (Ctrl+I).
Q: Can I use MT4 indicators on MT5? A: No, MQL4 and MQL5 are distinct languages; ensure the indicator is compiled specifically for your platform version.
Description & Settings
Here's how the indicator works:
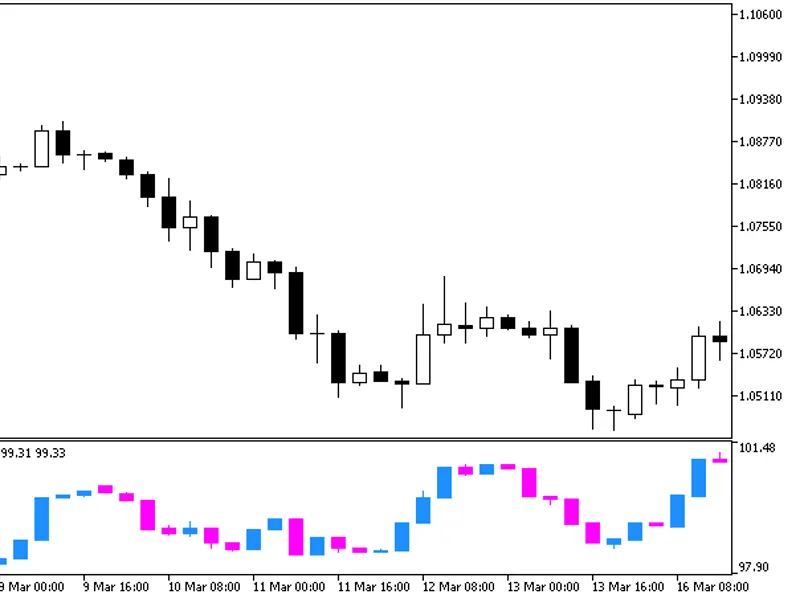
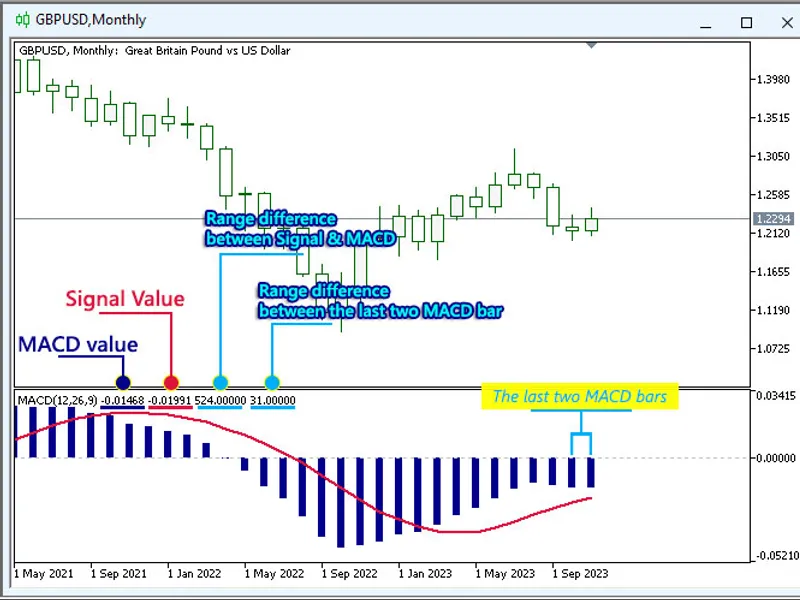
We know if the 'MACD bar' is heading up, it indicates an upward trend on this current timeframe; conversely, if the 'MACD bar' is heading down, it indicates a downward trend. In other conditions, when the current 'MACD bar' remains flat with no difference compared to the previous bar (0 pips), this forms a new resistance/support level.On the image below example, the difference in range of 'Signal-MACD' is 12 pips, and the range of the 'last two MACD bars' is 0 pips. This implies that the resistance/support level based on the 'last two MACD bars', in period H1, is at a price level 1.2283, while the resistance/support level based on 'Signal-MACD' will be at a price level 1.2271 (1.2283 - 12 pips).
Note:
Resistance-Support levels based on the MACD range distance are dynamic and applicable only within the same bar and the same period. If a new bar is formed, the Resistance-Support price levels will be reset.