Average Volumes (Volumes Forecasting)
This professional-grade solution for MetaTrader 5 helps traders achieve greater efficiency in their daily workflow. This technical indicator acts as a specialized analysis tool designed to visualize market data. It helps traders identify emerging trends, momentum shifts, and key support or resistance levels by plotting statistical calculations directly onto price charts.
How to Setup and Use Average Volumes (Volumes Forecasting)
1. Installation: Place your file in the MQL/Indicators folder via "Open Data Folder" and restart your terminal.
2. Loading: Find the indicator in the Navigator, drag it onto your chart, and configure the input parameters in the popup window.
3. Customization: Press Ctrl+I to open the indicator list, select your tool, and click "Properties" to change colors, levels, or visual styles.
4. Updating: Replace the old file in the Indicators folder with the new version and restart the platform to apply changes.
Frequently Asked Questions
Q: Why is my indicator not showing? A: Verify the file is in the MQL/Indicators folder, or try right-clicking the "Indicators" tree in the Navigator and clicking "Refresh."
Q: Do custom indicators slow down the platform? A: Too many complex indicators can impact performance; remove unused ones via the "Indicator List" (Ctrl+I).
Q: Can I use MT4 indicators on MT5? A: No, MQL4 and MQL5 are distinct languages; ensure the indicator is compiled specifically for your platform version.
Description & Settings
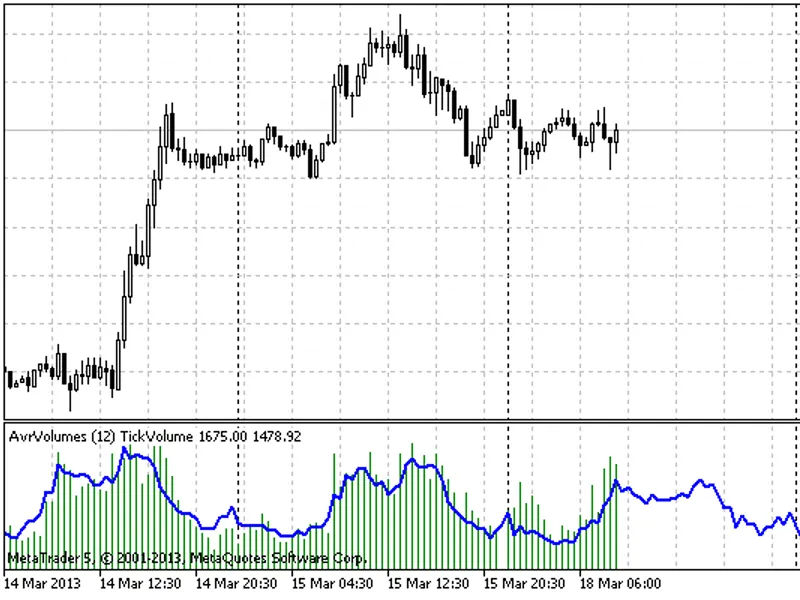
The indicator displays in a separate window "Tick Volume" or "Real Volume" volumes and their average value on history. The average value of volumes is used for drawing the forecast of their volumes value for the current and the following days.
The average value of volumes is performed considering the day of the week, i.e. Monday volumes average with the previous Mondays' volumes, Tuesday with Tuesdays and so on.
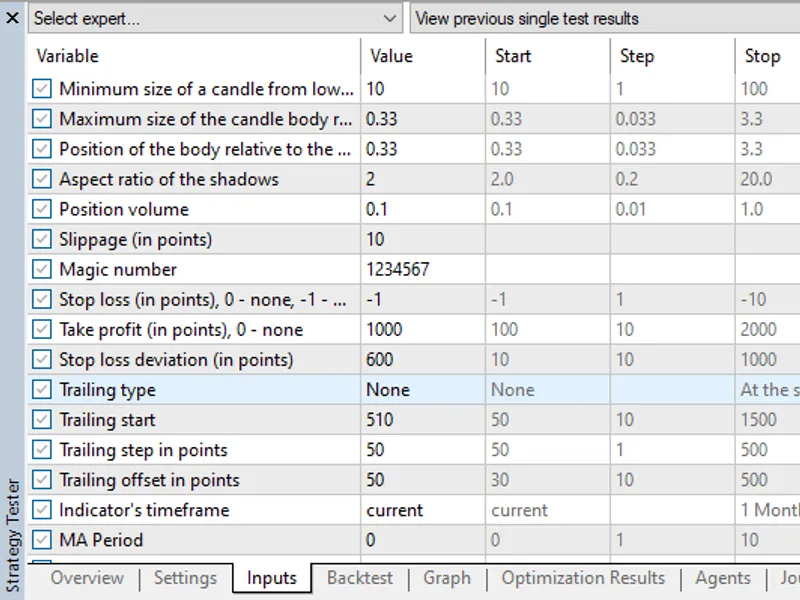
Set the number of averaging weeks and type of the displayed volumes in indicator input parameters. The number of the used averages can differ from the specified ones in parameters. If the terminal lack of data for the specified number of averaging weeks, for example, if insufficient value of the "Max bars in chart" terminal parameter set, then number of averages can be significantly less than the specified one.
The real number of average weeks can be seen, if set the mouse pointer to the line of average values. In this case it will be specified in the tooltip how many weeks succeeded to use for averaging.
Line of average values can be additionally processed by the median filter. It should also be considered that there is a risk to smooth some significant peak. Default median filter disabled.
If quotes supplier during the whole time of averaging didn't change the parameters of algorithm, then it will be well seen, if the current volumes were significantly less or more than the average value. Such situation can be considered as decrease or increase of the market activity relative to average value.
In addition to other things, when applying neural networks you can try to use for their learning not only the previous values, but also forecasted volume values.