AS Q Spread Logger
This is a powerful addition to your MetaTrader 5 toolkit designed to optimize market analysis and performance. This technical indicator acts as a specialized analysis tool designed to visualize market data. It helps traders identify emerging trends, momentum shifts, and key support or resistance levels by plotting statistical calculations directly onto price charts.
How to Setup and Use AS Q Spread Logger
1. Installation: Place your file in the MQL/Indicators folder via "Open Data Folder" and restart your terminal.
2. Loading: Find the indicator in the Navigator, drag it onto your chart, and configure the input parameters in the popup window.
3. Customization: Press Ctrl+I to open the indicator list, select your tool, and click "Properties" to change colors, levels, or visual styles.
4. Updating: Replace the old file in the Indicators folder with the new version and restart the platform to apply changes.
Frequently Asked Questions
Q: Why is my indicator not showing? A: Verify the file is in the MQL/Indicators folder, or try right-clicking the "Indicators" tree in the Navigator and clicking "Refresh."
Q: Do custom indicators slow down the platform? A: Too many complex indicators can impact performance; remove unused ones via the "Indicator List" (Ctrl+I).
Q: Can I use MT4 indicators on MT5? A: No, MQL4 and MQL5 are distinct languages; ensure the indicator is compiled specifically for your platform version.
Description & Settings
AlgoSphere Quant — Precision before profit.
ASQ Spread Logger is a lightweight indicator that monitors spread in real time and gives you the data to make better entry decisions. Whether you scalp during tight sessions or avoid news spikes, this tool shows you exactly what your broker is charging — and logs it for later analysis.
What it does
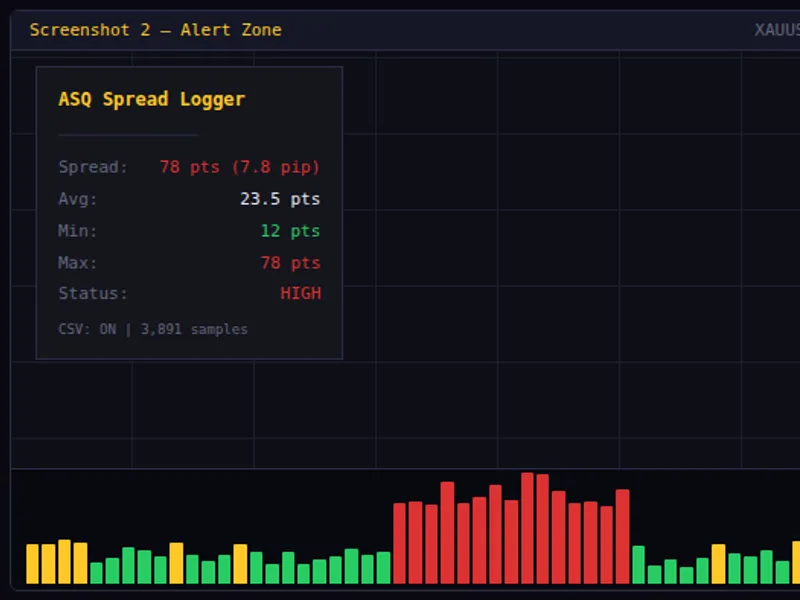
The indicator draws a color-coded histogram in a separate window: green when the spread is low, gold when it is moderate, and red when it exceeds your threshold. A clean on-chart panel displays the current spread in both points and pips, the rolling average, the minimum and maximum over your chosen window, and the current status level.
Every data point can be logged to a CSV file (DateTime, Symbol, Spread, Bid, Ask, Avg, Min, Max, Status) so you can analyze spread behavior across sessions, days, or brokers in Excel or Python. Three logging frequencies are available: every tick, every second, or once per new bar.
Features
Color-coded spread histogram (green / gold / red) in a separate window
On-chart statistics panel: current spread, average, min, max, status
CSV export to MQL5/Files/ with full bid/ask and status data
Three logging modes: every tick, every second, every new bar
Configurable low/high thresholds in points
Threshold reference lines on the histogram
Alert cooldown to prevent spam
Panel corner, offset, font, and color customization
Minimal CPU usage — single-file, no external dependencies
Use cases
Scalping: enter only when the spread is below your threshold
News trading: monitor spread expansion before and after high-impact events
Broker comparison: log spread data across multiple brokers and compare in Excel
Session analysis: identify which hours offer the tightest spreads
Prop firm compliance: document that you traded during acceptable spread conditions
Parameters
Installation
Download ASQ_SpreadLogger.mq5
Place in MQL5/Indicators/
Compile in MetaEditor (zero dependencies)
Drag onto any chart
Compatibility
MetaTrader 5, all brokers, all instruments (Forex, Metals, Indices, Crypto), all timeframes.
Free and open-source under the AlgoSphere Quant brand.