3 Parabolic System
This is a powerful addition to your MetaTrader 5 toolkit designed to optimize market analysis and performance. This technical indicator acts as a specialized analysis tool designed to visualize market data. It helps traders identify emerging trends, momentum shifts, and key support or resistance levels by plotting statistical calculations directly onto price charts.
How to Setup and Use 3 Parabolic System
1. Installation: Place your file in the MQL/Indicators folder via "Open Data Folder" and restart your terminal.
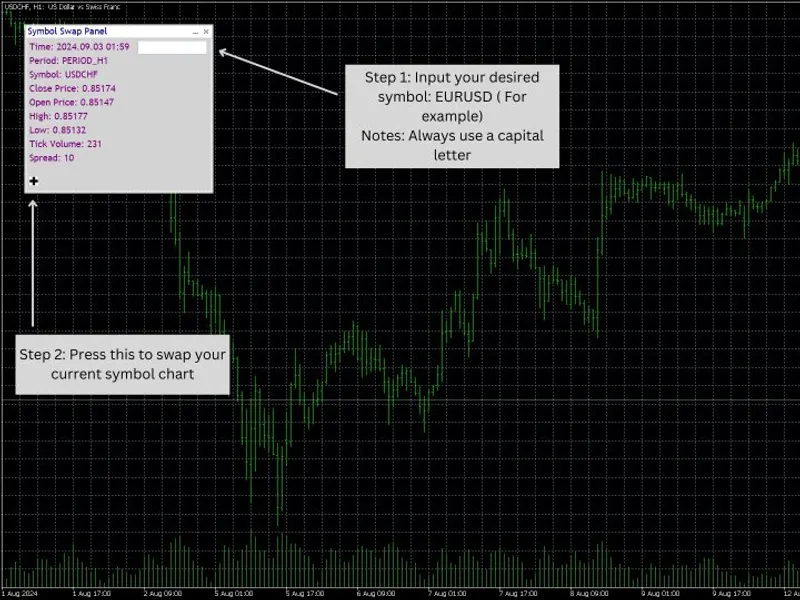
2. Loading: Find the indicator in the Navigator, drag it onto your chart, and configure the input parameters in the popup window.
3. Customization: Press Ctrl+I to open the indicator list, select your tool, and click "Properties" to change colors, levels, or visual styles.
4. Updating: Replace the old file in the Indicators folder with the new version and restart the platform to apply changes.
Frequently Asked Questions
Q: Why is my indicator not showing? A: Verify the file is in the MQL/Indicators folder, or try right-clicking the "Indicators" tree in the Navigator and clicking "Refresh."
Q: Do custom indicators slow down the platform? A: Too many complex indicators can impact performance; remove unused ones via the "Indicator List" (Ctrl+I).
Q: Can I use MT4 indicators on MT5? A: No, MQL4 and MQL5 are distinct languages; ensure the indicator is compiled specifically for your platform version.
Description & Settings
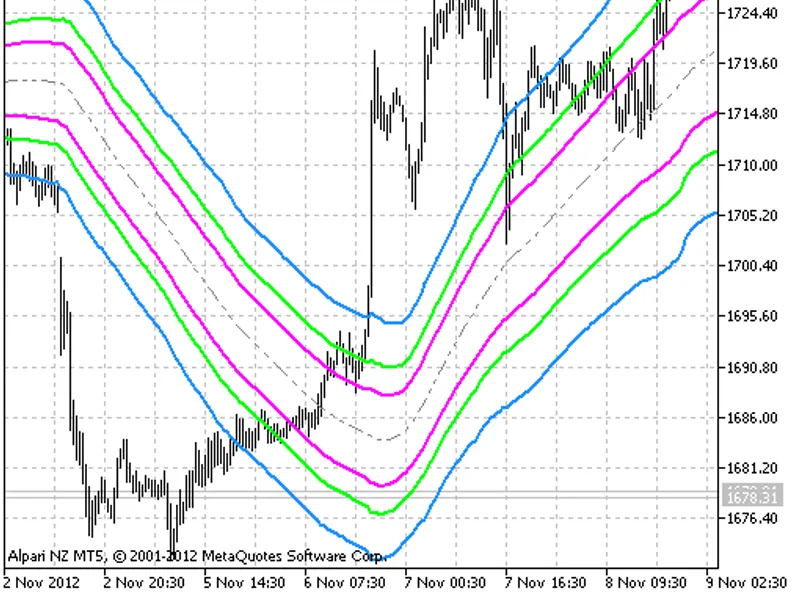
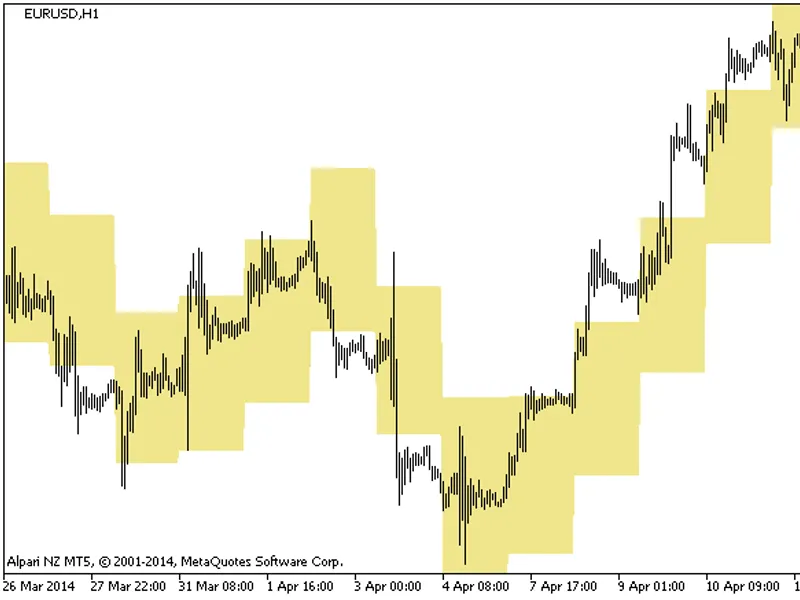
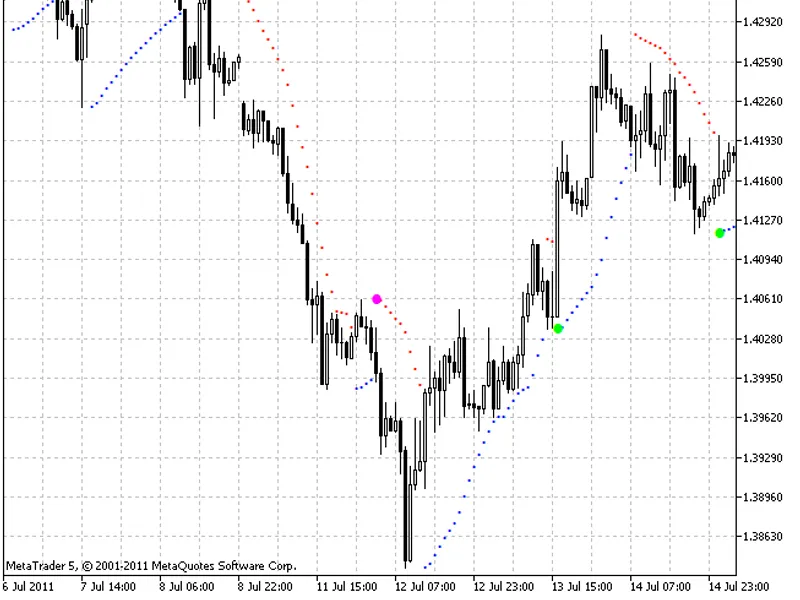
This indicator generates signals for performing deals using alerts and colored dots on a chart.
Senior and middle timeframes are searched for Parabolic SAR indicator trend signals, while the junior timeframe is searched for a trend reversal signals.
For example, when parabolics are moving up at senior and middle charts while being lower than the current price and the parabolic has changed its location from "above the price" to "below the price" at the junior chart, then a buy signal is generated. A sell signal is generated the same way.
Indicator input parameters: