Zigzag fibo oscillator
This software component for MetaTrader 5 is built to enhance the capabilities of your trading environment. This technical indicator acts as a specialized analysis tool designed to visualize market data. It helps traders identify emerging trends, momentum shifts, and key support or resistance levels by plotting statistical calculations directly onto price charts.
How to Setup and Use Zigzag fibo oscillator
1. Installation: Place your file in the MQL/Indicators folder via "Open Data Folder" and restart your terminal.
2. Loading: Find the indicator in the Navigator, drag it onto your chart, and configure the input parameters in the popup window.
3. Customization: Press Ctrl+I to open the indicator list, select your tool, and click "Properties" to change colors, levels, or visual styles.
4. Updating: Replace the old file in the Indicators folder with the new version and restart the platform to apply changes.
Frequently Asked Questions
Q: Why is my indicator not showing? A: Verify the file is in the MQL/Indicators folder, or try right-clicking the "Indicators" tree in the Navigator and clicking "Refresh."
Q: Do custom indicators slow down the platform? A: Too many complex indicators can impact performance; remove unused ones via the "Indicator List" (Ctrl+I).
Q: Can I use MT4 indicators on MT5? A: No, MQL4 and MQL5 are distinct languages; ensure the indicator is compiled specifically for your platform version.
Description & Settings
Here are some differences and advancements:
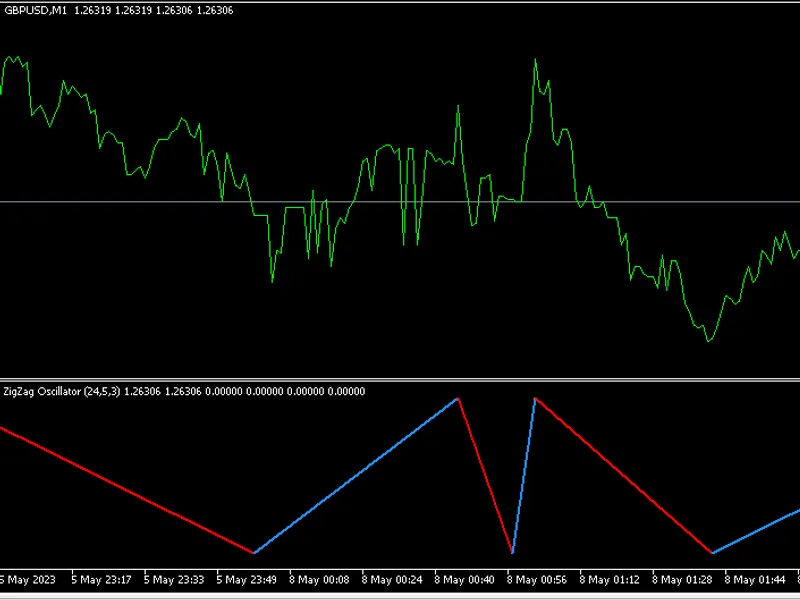
- The zigzag has two modes "Oscillator" and "HighLow". The oscillator mode will show a visual oscillation of the zigzag swings, even though it's not a true oscillator and it doesn't have a fixed range.
The extreme low becomes the symbol point value, and the extreme high is the highs as normal in this mode.
- The HighLow mode respects the prices of extreme highs and lows (as the normal Zigzag does). Fibonacci retracement levels are added, and the levels are dynamically scaled so that, visually, they remain fixed in place. It's not possible to scale a price chart adequately when prices can vary greatly in magnitude over time, so the dynamic scaling of the Zigzag in this mode only applies to the last extreme swing price and current extreme swing price.
- In each of the modes, the current leg is drawn even if it is not confirmed yet, and it will track the price that is specified in the inputs. There is a choice to track open, close, high, low, weighted, or typical price for the current bar.
The idea behind the current unconfirmed leg being drawn is to help see what is happening in real-time, and to help with that, the colouring of the current leg is carefully applied.
When the upward leg is currently in the process of being confirmed, it will color blue when the price is bullish, and will color grey for every bearish divergence.When the downward leg is in the process of being confirmed, it will color red when the price is bearish, and will color grey for every bullish divergence.
To help depict the trend color of the unconfirmed leg with real-time price action, volume is also checked. The bull color will override the current leg color if there's significant bullish volume, and likewise, the bear color will override the current leg color if there's significant bearish volume.
---------------------------------------------------------------------------------------------------------------------