Fibonacci retracement
This software component for MetaTrader 5 is built to enhance the capabilities of your trading environment. This technical indicator acts as a specialized analysis tool designed to visualize market data. It helps traders identify emerging trends, momentum shifts, and key support or resistance levels by plotting statistical calculations directly onto price charts.
How to Setup and Use Fibonacci retracement
1. Installation: Place your file in the MQL/Indicators folder via "Open Data Folder" and restart your terminal.
2. Loading: Find the indicator in the Navigator, drag it onto your chart, and configure the input parameters in the popup window.
3. Customization: Press Ctrl+I to open the indicator list, select your tool, and click "Properties" to change colors, levels, or visual styles.
4. Updating: Replace the old file in the Indicators folder with the new version and restart the platform to apply changes.
Frequently Asked Questions
Q: Why is my indicator not showing? A: Verify the file is in the MQL/Indicators folder, or try right-clicking the "Indicators" tree in the Navigator and clicking "Refresh."
Q: Do custom indicators slow down the platform? A: Too many complex indicators can impact performance; remove unused ones via the "Indicator List" (Ctrl+I).
Q: Can I use MT4 indicators on MT5? A: No, MQL4 and MQL5 are distinct languages; ensure the indicator is compiled specifically for your platform version.
Description & Settings
ggekko
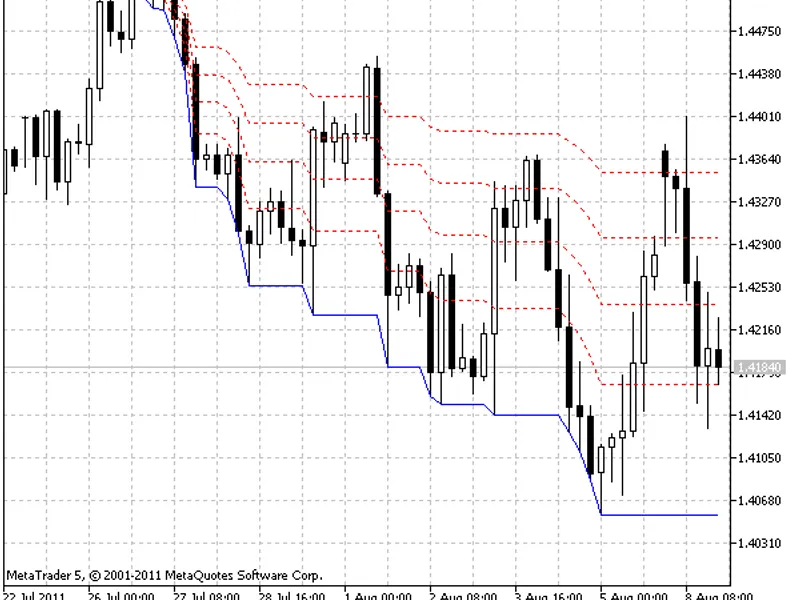
The indicator plots the Fibonacci retracement levels on the chart for a user-defined number of bars without having to draw the .
The user specifies how many bars they want to use for the retracement and then the indicator keeps track of the highest highs and lowest lows and plots the levels accordingly.
If a new high is more recent than a new low, then the indicator assumes it to be an uptrend and the levels show were the price might encounter support if it retraces. If a low is more recent than a high, then the indicator assumes it to be a downtrend and the lines show were the price might encounter resistance if it retraces.
The original idea and code were published in the 2011.04.11.