3 D Moving Average Indicator
This tool for MetaTrader 5 is specifically engineered to streamline your trading operations. This technical indicator acts as a specialized analysis tool designed to visualize market data. It helps traders identify emerging trends, momentum shifts, and key support or resistance levels by plotting statistical calculations directly onto price charts.
How to Setup and Use 3 D Moving Average Indicator
1. Installation: Place your file in the MQL/Indicators folder via "Open Data Folder" and restart your terminal.
2. Loading: Find the indicator in the Navigator, drag it onto your chart, and configure the input parameters in the popup window.
3. Customization: Press Ctrl+I to open the indicator list, select your tool, and click "Properties" to change colors, levels, or visual styles.
4. Updating: Replace the old file in the Indicators folder with the new version and restart the platform to apply changes.
Frequently Asked Questions
Q: Why is my indicator not showing? A: Verify the file is in the MQL/Indicators folder, or try right-clicking the "Indicators" tree in the Navigator and clicking "Refresh."
Q: Do custom indicators slow down the platform? A: Too many complex indicators can impact performance; remove unused ones via the "Indicator List" (Ctrl+I).
Q: Can I use MT4 indicators on MT5? A: No, MQL4 and MQL5 are distinct languages; ensure the indicator is compiled specifically for your platform version.
Description & Settings
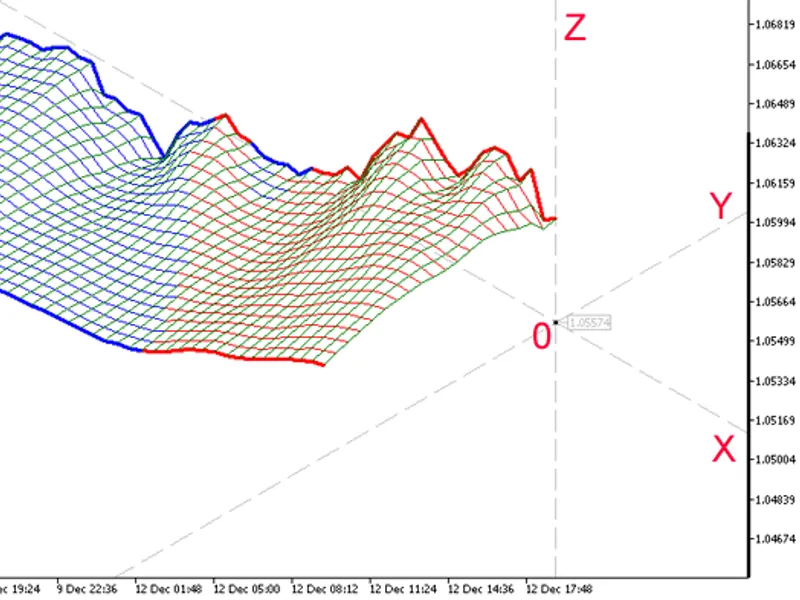
Demonstration of three-dimensional visualization possibilities in MetaTrader 5.
A surface is generated using a series of indicators. The surface is displayed in a three-dimensional coordinate system.
The coordinate system can be rotated about the vertical
Z
axis by changing the slope of the
X
or
Y
axes. Moving the center of coordinates along the Z axis will change the coloring of the grid lines: red color — nodes are above the XY plane, blue means they are below the plane.
Fig. 1. Demonstration of the 3D Moving Average
Note:
Formation of a 3D surface requires some time.
Select the minimum chart scale.