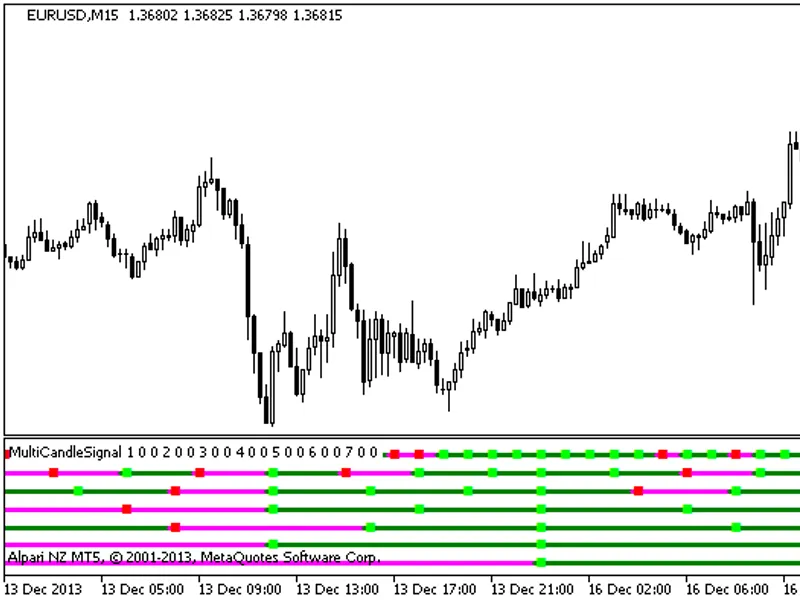
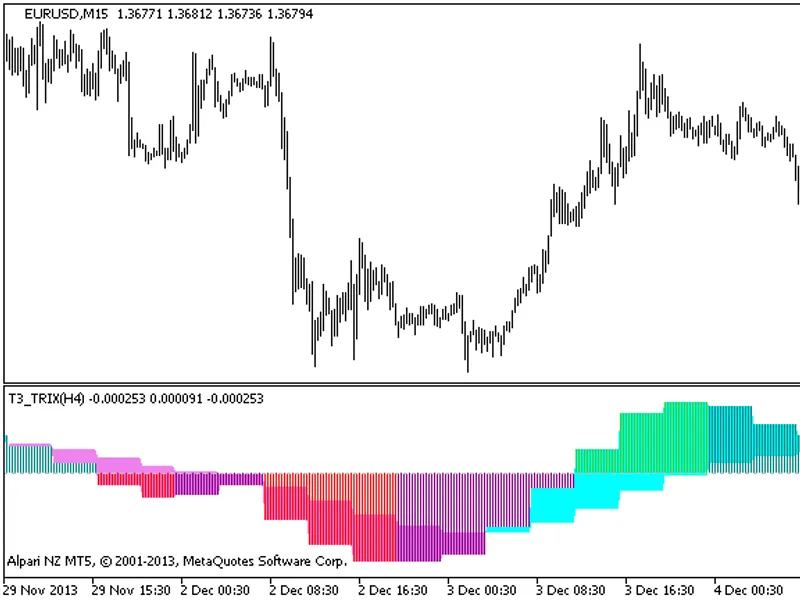
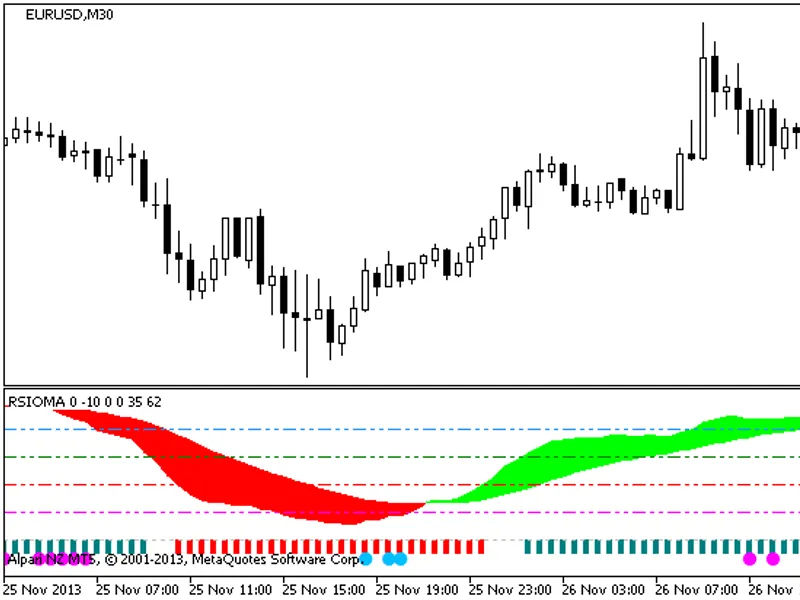
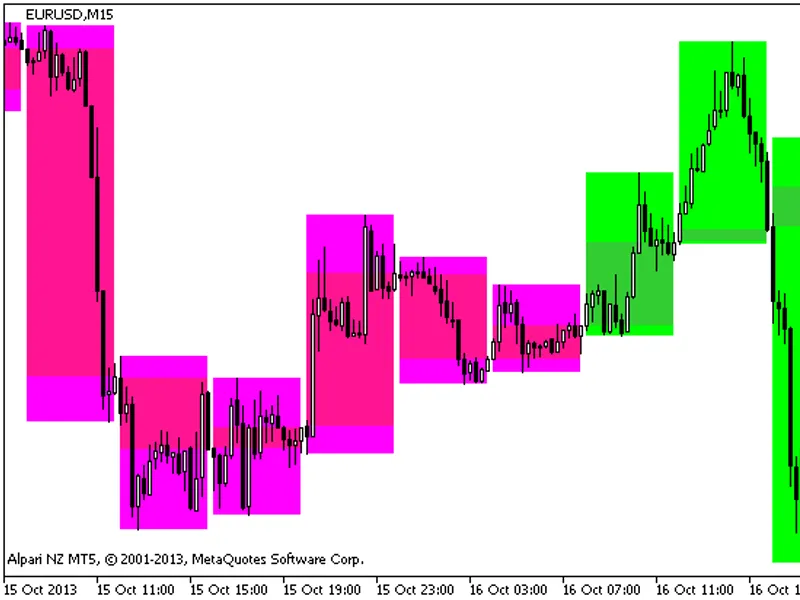
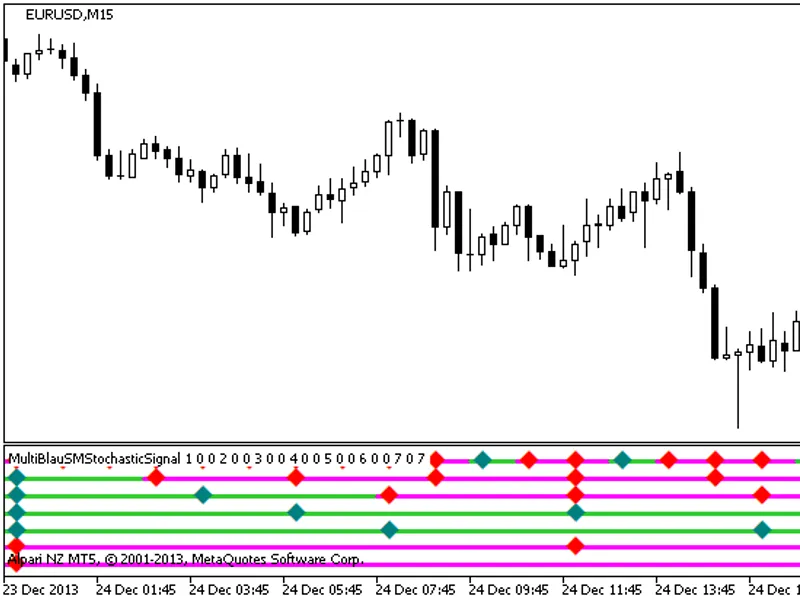
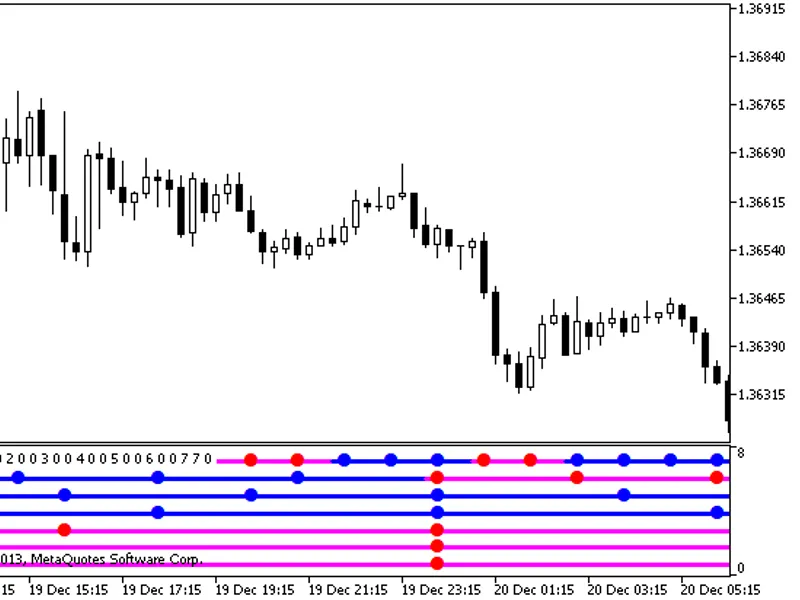
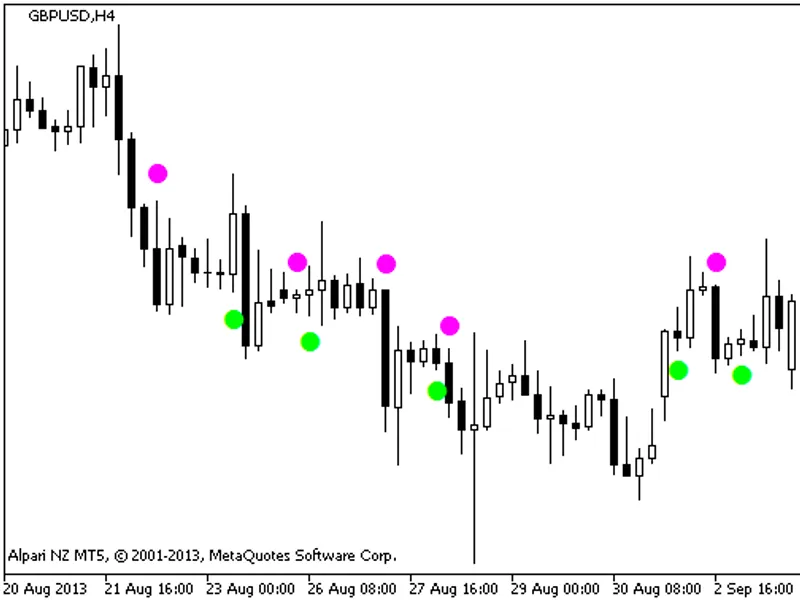
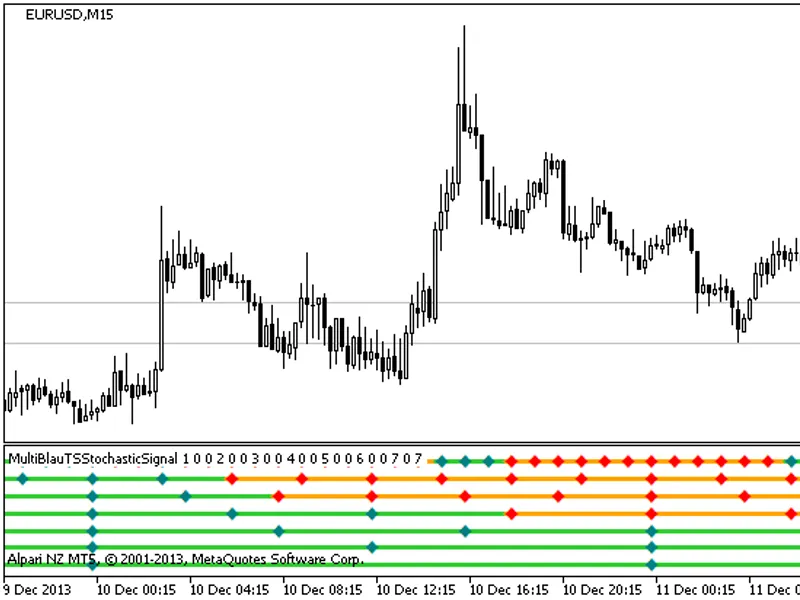
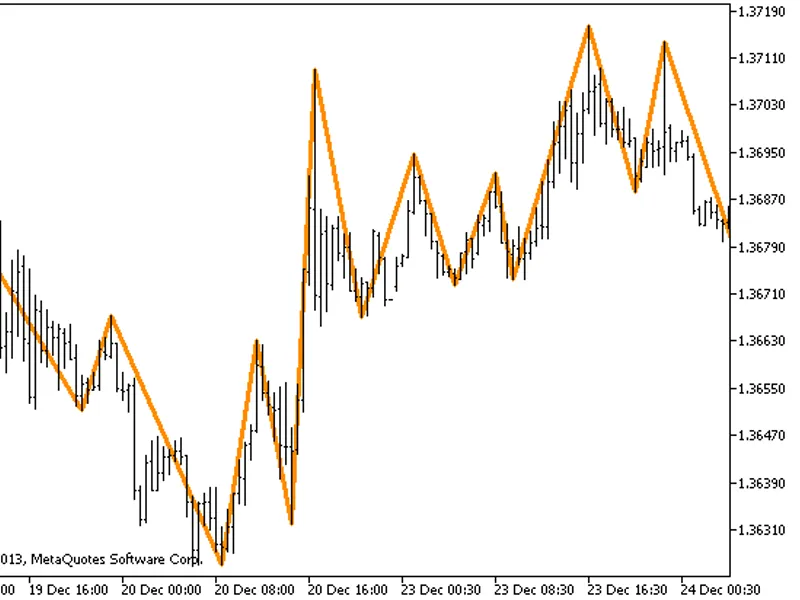
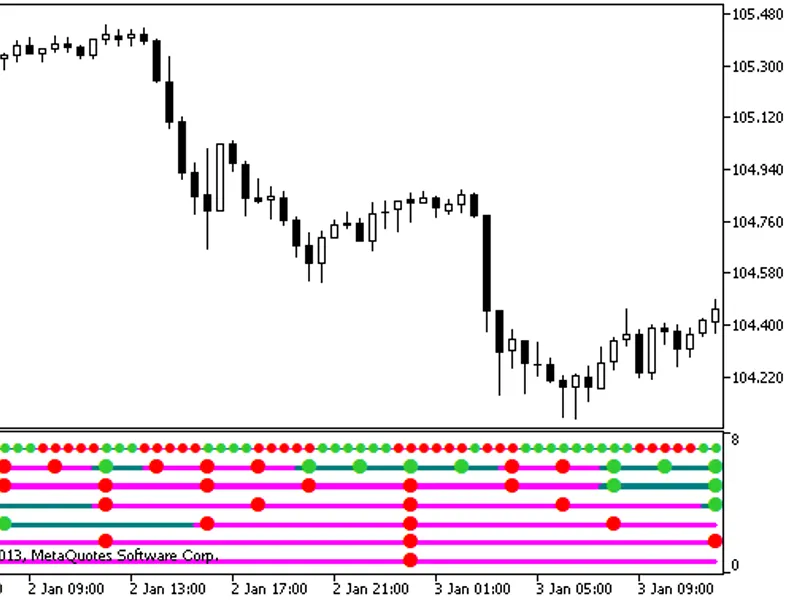
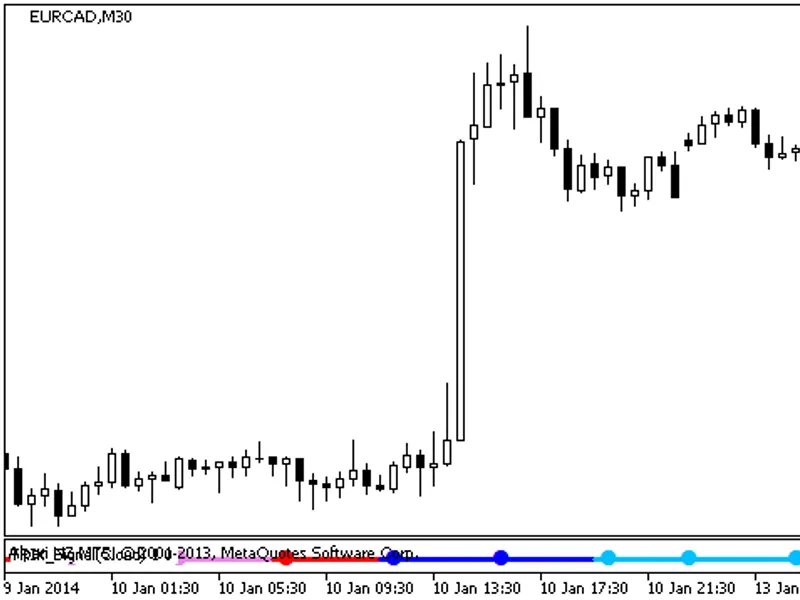
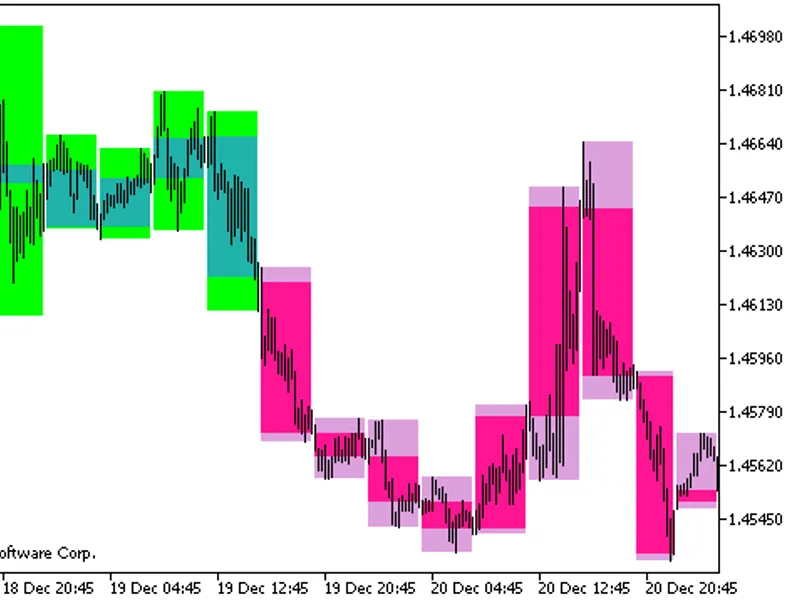
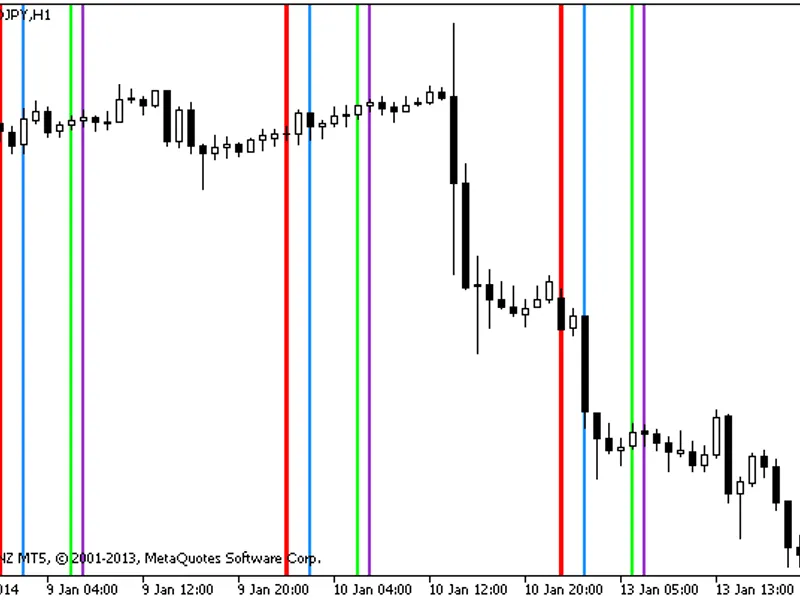
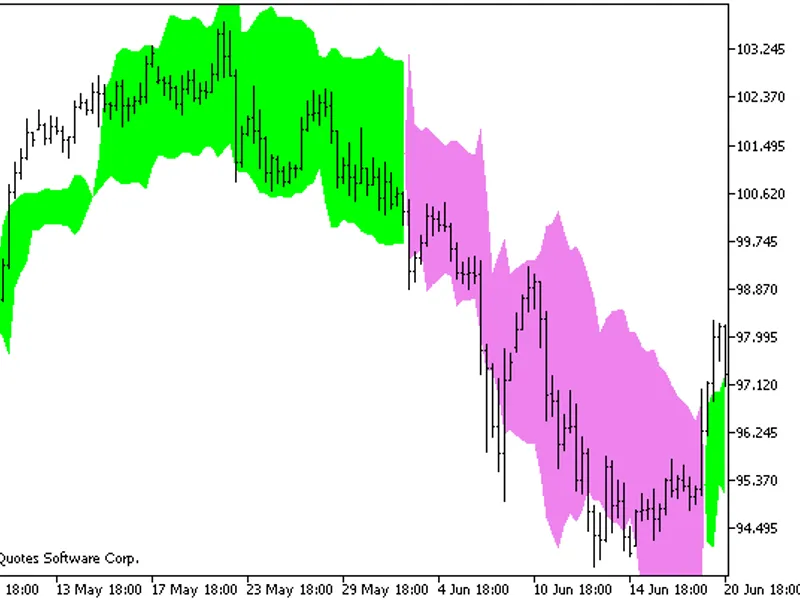
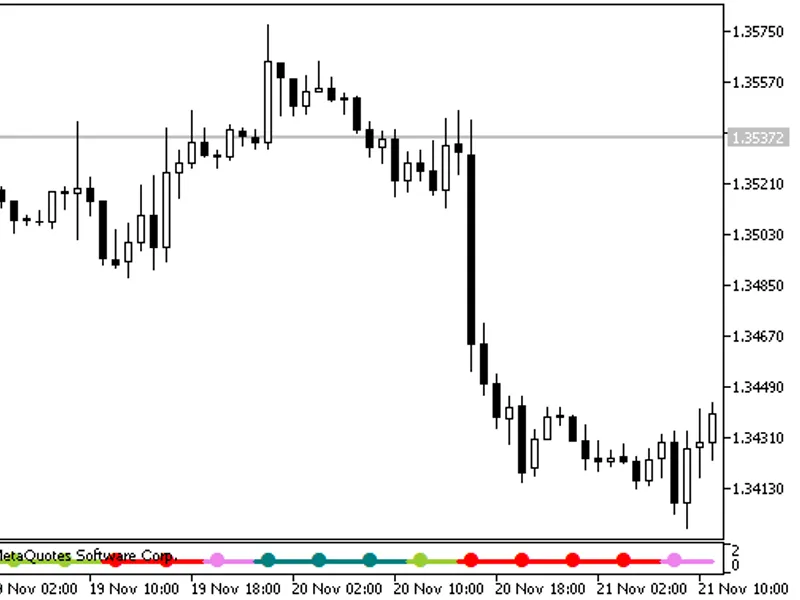
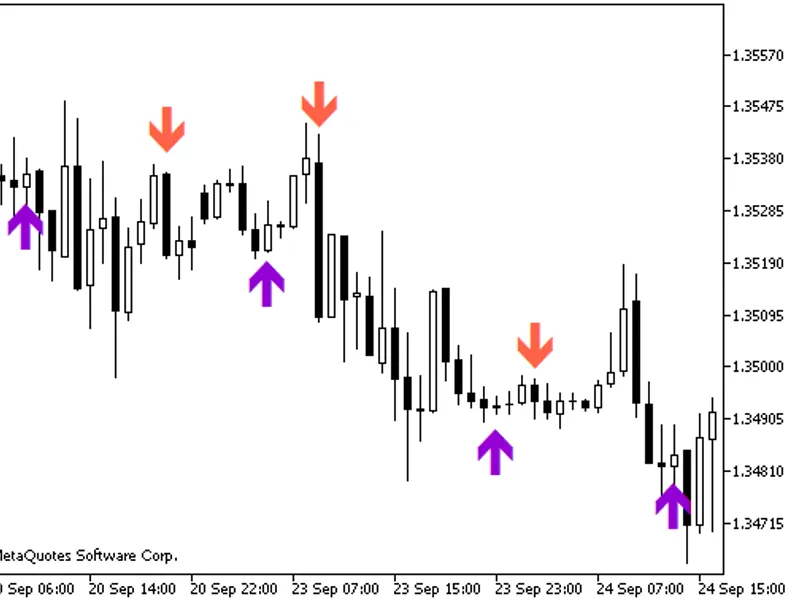
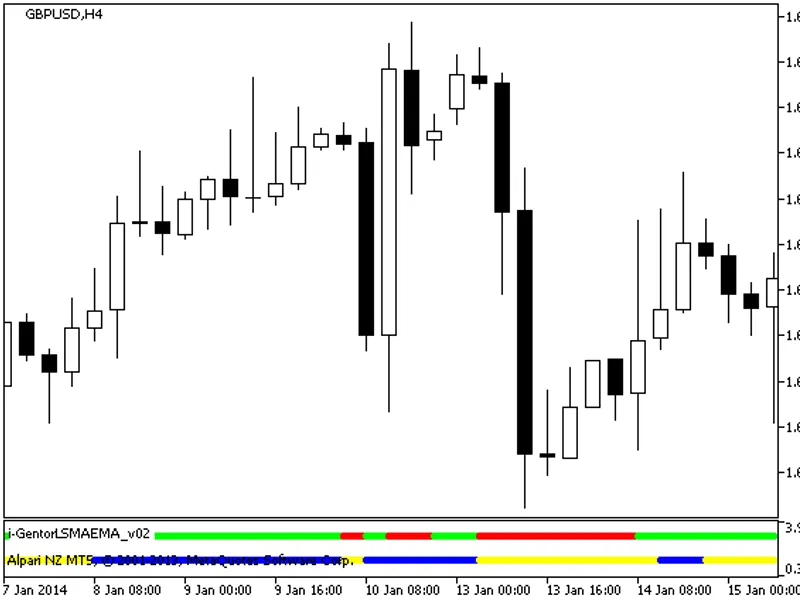
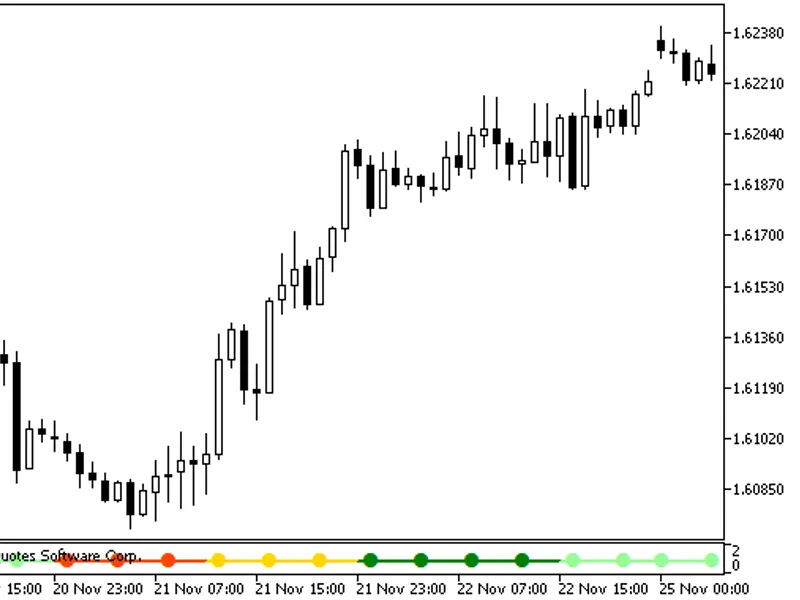
The MultiCandleSignal indicator provides insights into current trends by analyzing candlestick direction across seven distinct timeframes.Each of the seven indicator lines represen...
The T3 Trix HTF indicator is a tool with a timeframe selection option available in its input parameters. It requires the compiled indicator file t3_trix.mq5 for operation, which sh...
RSI Oscillator Moving Average Indicator
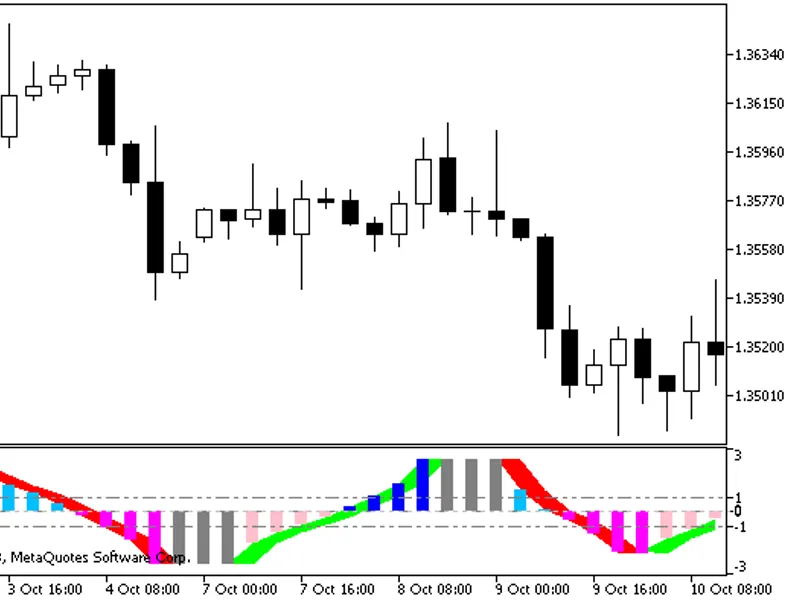
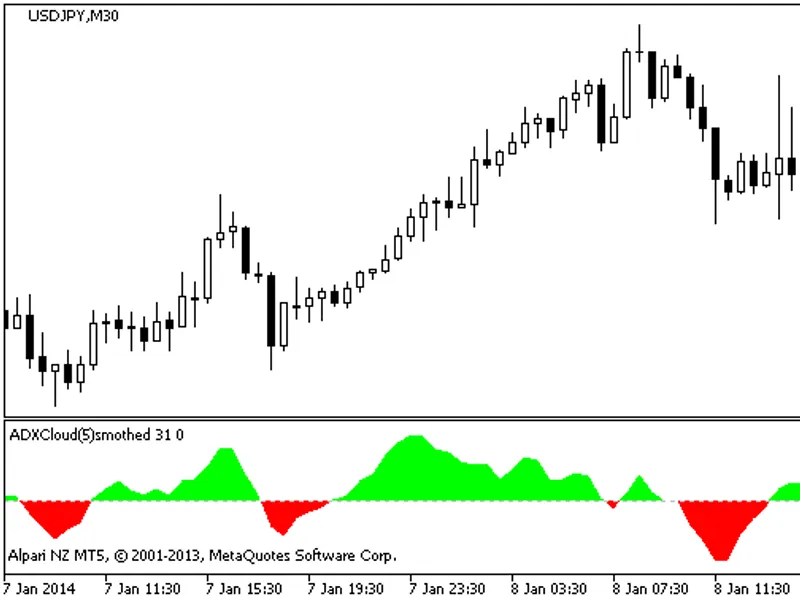
This indicator utilizes an oscillator algorithm represented as a colored cloud, with additional indications.
The color histogram defines t...
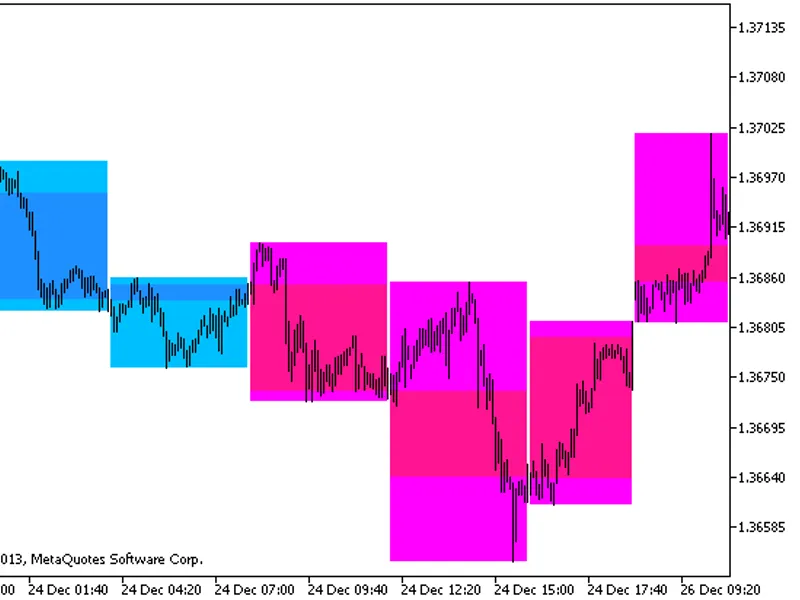
The indicator displays larger timeframe candlesticks as colored filled rectangles using buffers.
Rectangles are colored based on the histogram's direction change.
The candlestick b...
The Fisher Cyber Cycle HTF indicator includes a timeframe selection option within its input parameters.For proper operation, the indicator requires the compiled indicator file fish...
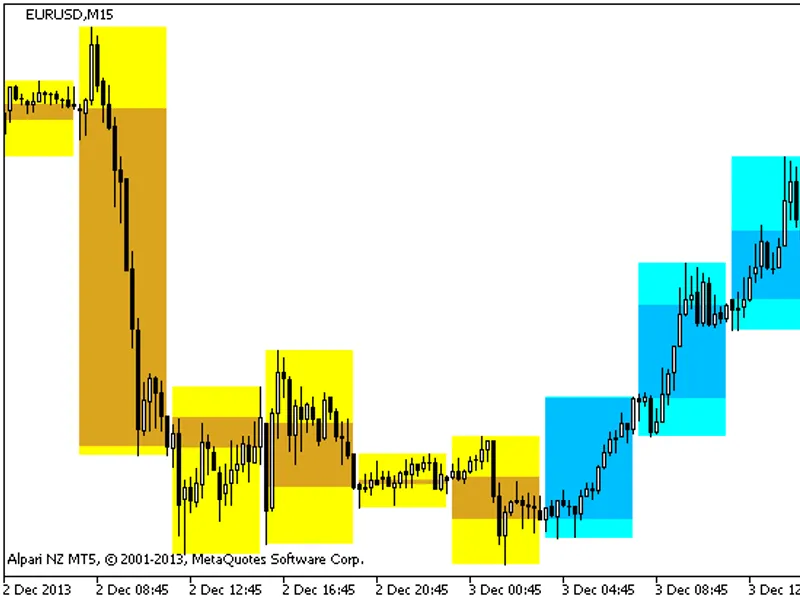
This indicator displays candlesticks from a larger timeframe as colored, filled rectangles using buffers. The rectangles are filled based on histogram direction changes. The candle...
The Multi BlauSmStochasticX7 Signal Indicator displays active trend information by aggregating values from seven indicators across different timeframes.Each line on the indicator r...
This indicator draws larger timeframe candlesticks as color-filled rectangles using buffers. The rectangles are colored according to the direction of the histogram or the colored c...
The Multi T3 TRIX X7 Signal indicator displays active trend information by utilizing the values of seven indicators across different timeframes. Each line on the indicator correspo...
ADX Crossing is a semaphore arrow indicator designed to signal trading opportunities based on the crossover of the DI+ and DI- lines of the Average Directional Movement Index (ADX)...
The Multi Blau Stochastic x7 Signal indicator displays information on active trends by utilizing the values from seven different timeframes.Each line on the indicator corresponds t...
CrazyChartThe ZigZag indicator utilizing the Joe DiNapoli algorithm.Originally, this indicator was developed in MQL4 and first published on 10/03/2026.Figure 1. The DiNapoli_ZZ Ind...
A modest pivot points indicator.Originally, this indicator was written in MQL4 and was first published on 02.10.2026.Figure 1. The Dyn_Pivot Indicator...
WiseMan Semaphore Signal Indicator.This indicator is based on Bill Williams' indicators.The original indicator was written in MQL4 and first published on October 2, 2026.Figure 1. ...
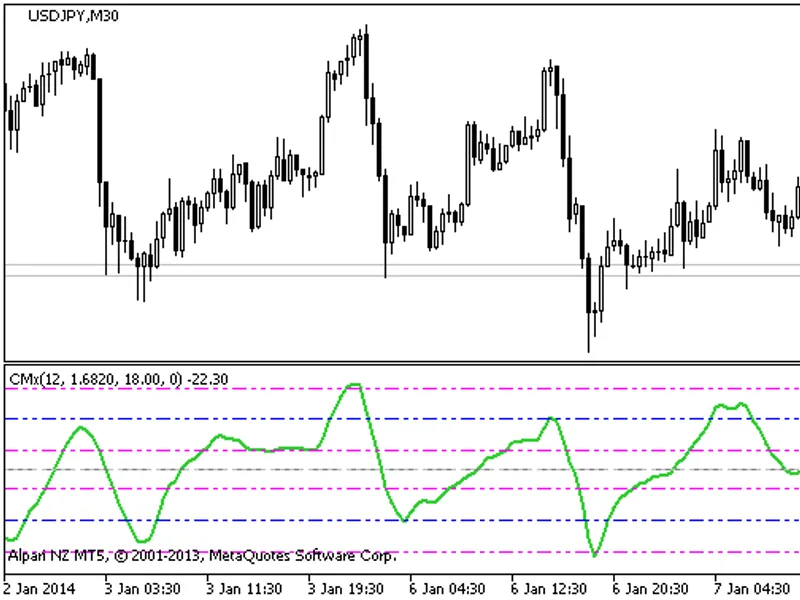
This indicator combines channel, bands, and Fibonacci levels.The indicator was originally written in MQL4 and first published on 10.15.2026.Figure 1. The CMX Indicator...
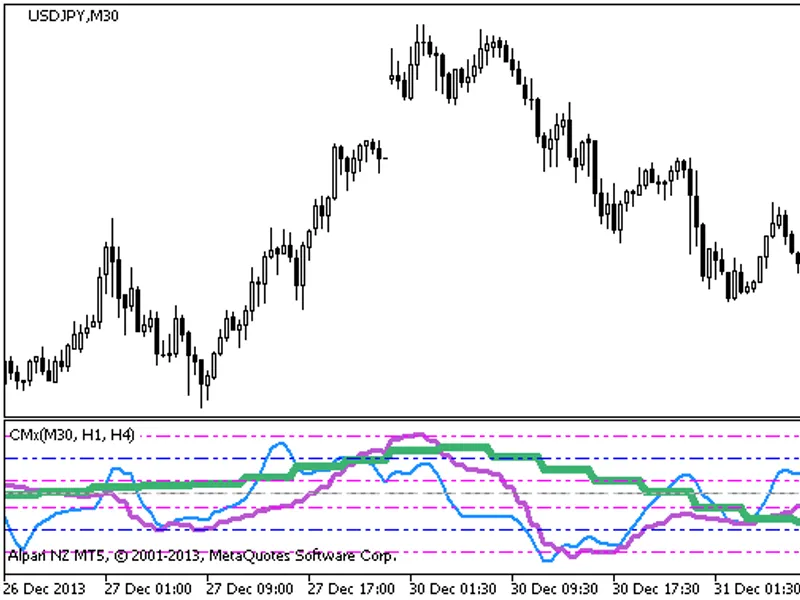
The CMX 3HTF indicator displays three oscillators, each on a different timeframe, all within a single chart.Figure 1 shows an example of the CMX 3HTF indicator....
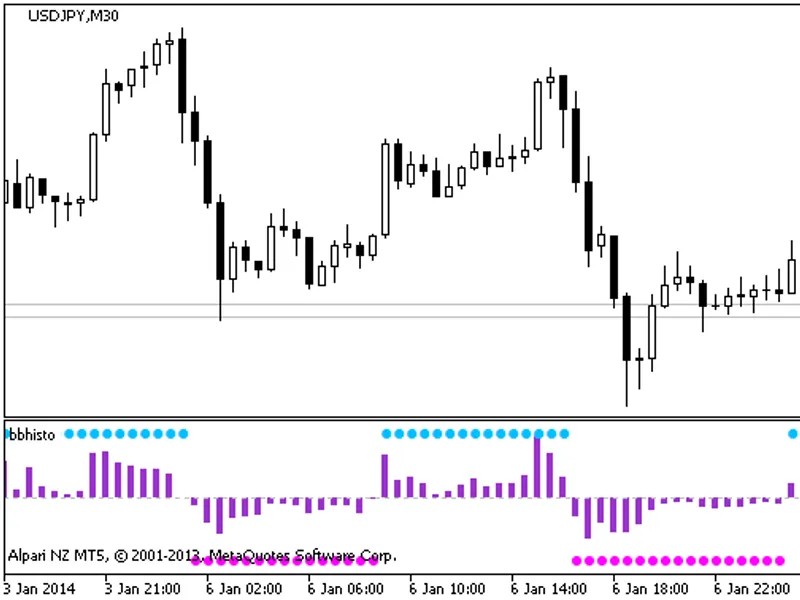
BBHisto Trend IndicatorA trend indicator.Originally developed in MQL4 and first published on January 1, 2007. Updated for 2026.Figure 1. The BBHisto Indicator...
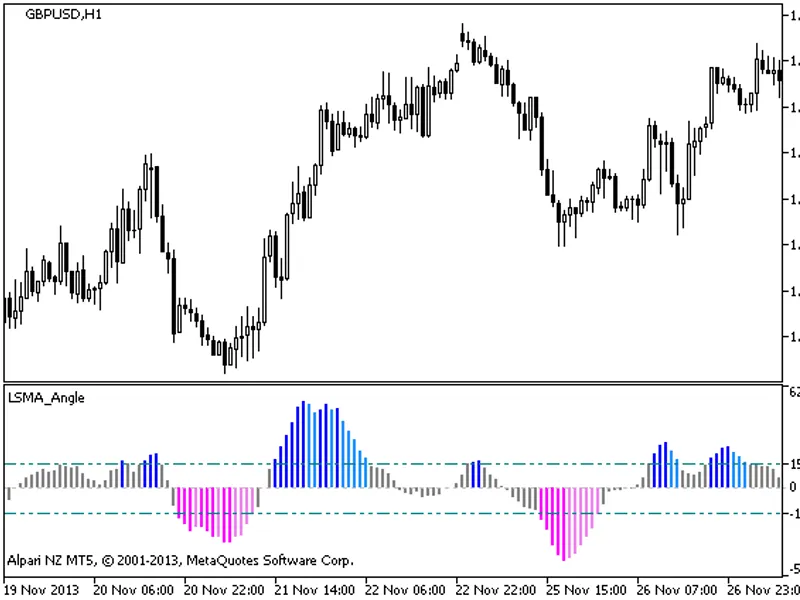
LSMA AngleThe LSMA Angle is a trend indicator presented as a histogram. When the trend is weak, the histogram appears gray.The trigger threshold is determined by the indicator's in...
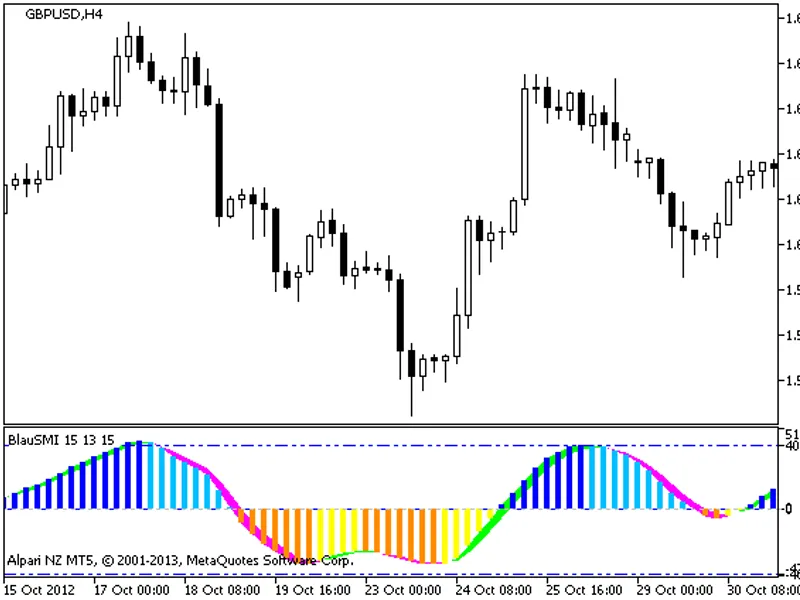
Stochastic Momentum Indicator (SMI) implemented as a color histogram with a signal line represented by a colored cloud.The indicator utilizes classes from the smoothalgorithms.mqh ...
The Multi JFATLSPEEDx7 Signal indicator displays active trend information by integrating the values of seven indicators across different timeframes.Each JFATLSPEED oscillator has a...
Smooth Stochastic Indicator.This indicator applies smoothing to the main and signal lines of the Stochastic oscillator. The values are then filtered using an averaging algorithm to...
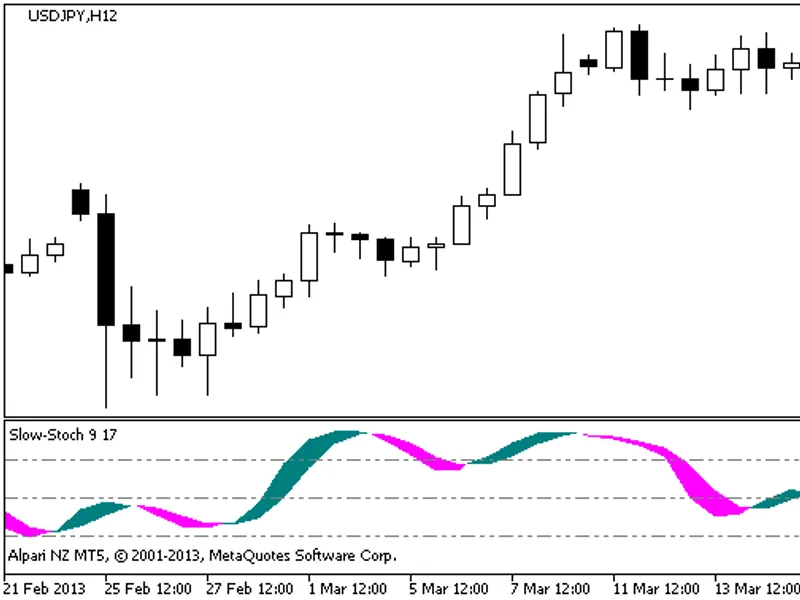
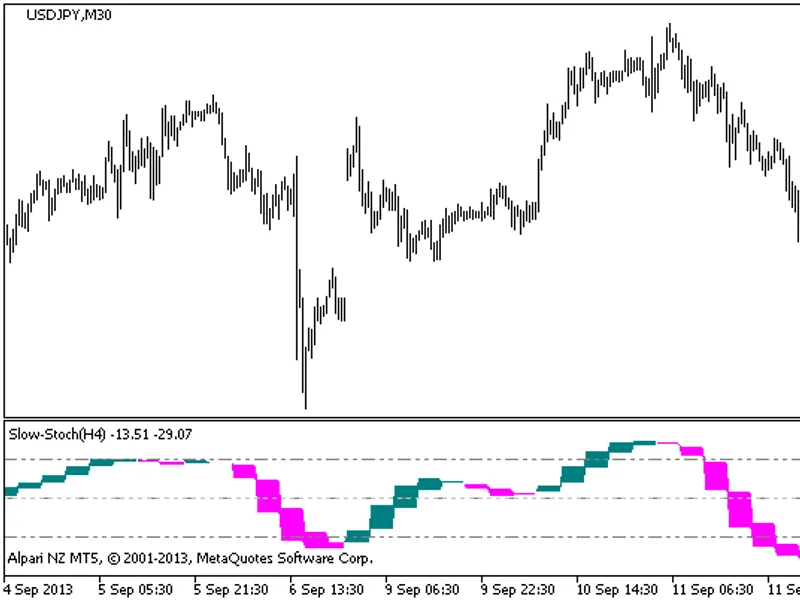
Slow Stochastic HTF Indicator with Timeframe SelectionThis indicator includes a timeframe selection option directly within its input parameters.The indicator requires the compiled ...
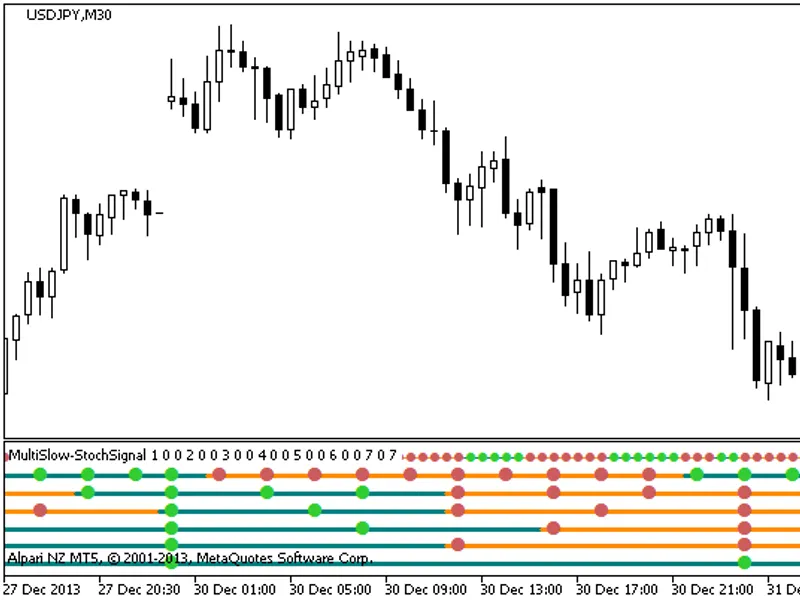
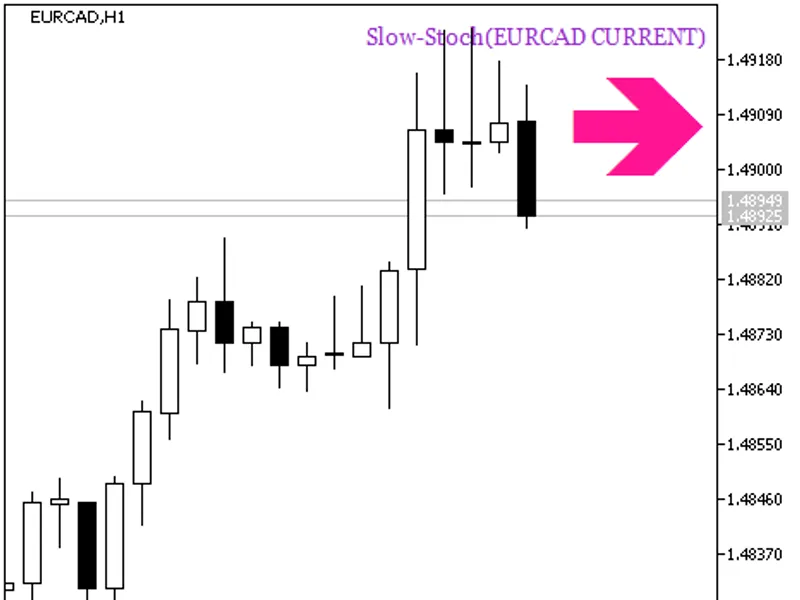
The Multi Slow Stochastic x7 Signal indicator displays active trend information using values from seven different timeframes.Each of the seven indicator lines corresponds to a Slow...
The Slow Stochastic HTF Signal indicator displays trend direction using data from the indicator on a selected bar, represented graphically with colored indications for trend or tra...
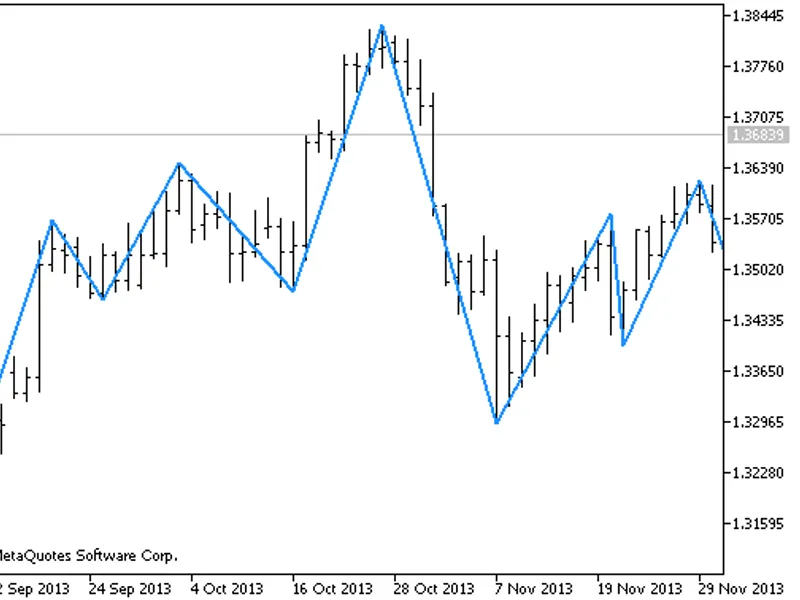
The RVM Gann SV8 indicator implements the Gann principle in a zigzag format.This indicator was originally developed in MQL4 and first published on 28.09.2007.Figure 1. The RVM Gann...
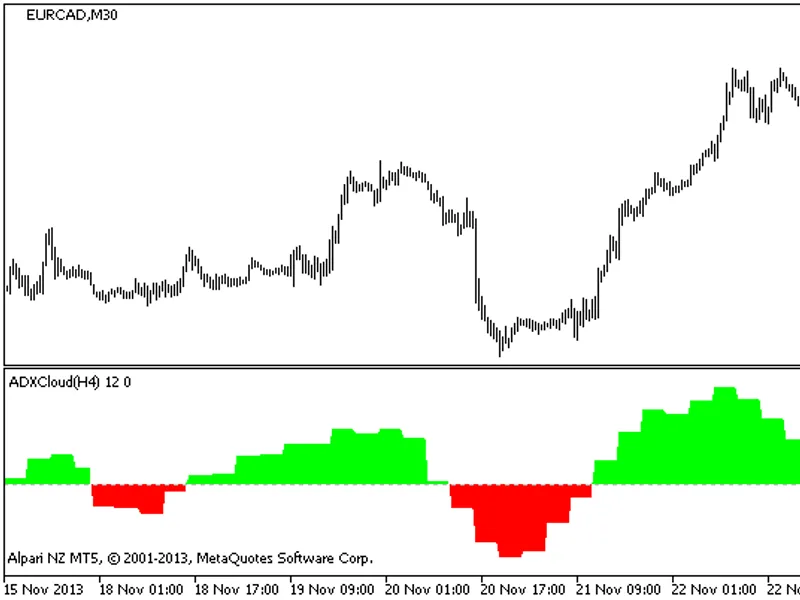
ADX Cloud HTF Indicator with Timeframe Selection OptionThis indicator includes a timeframe selection option within its input parameters.To ensure proper operation, the indicator re...
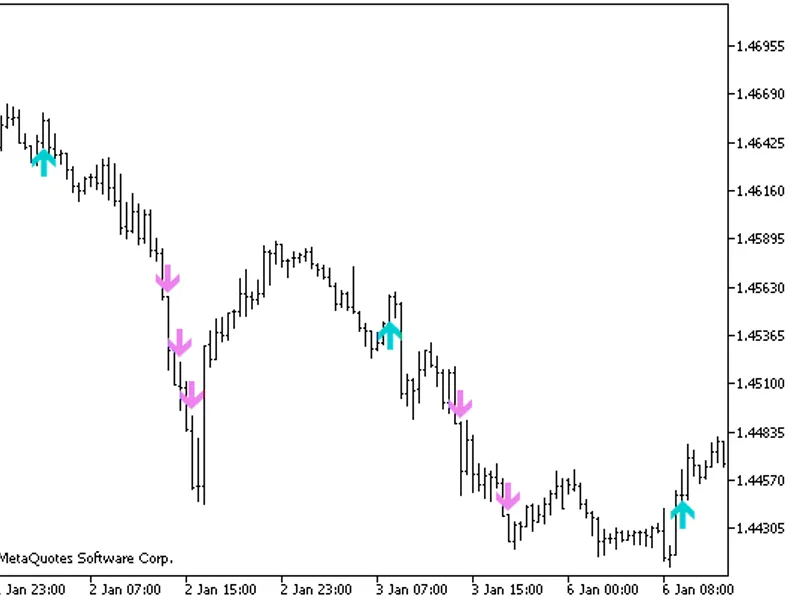
The 20's indicator is a semaphore signal indicator that does not use averages to determine signals.Indicator OverviewThe indicator was originally written in MQL4 and was first publ...
The T3 Trix Signal indicator provides information on the current trend using the values of the indicator with a fixed timeframe.Indicator DescriptionThe histogram of the initial in...
This indicator displays larger timeframe candlesticks as color-filled rectangles using buffers. The rectangles are color-filled based on indicator values.The candlestick body is pa...
This indicator draws four vertical colored lines during a day. Line parameters can be set in the input parameters. The Timezones indicator is used to display time zones. It was ori...
This is a trend indicator drawn in the form of a colored cloud with stops beyond the range of the colored cloud.Indicator OverviewThe Chandelier Exit indicator is a trend indicator...
The Bollinger Bands Stop indicator is available with a timeframe selection option in the input parameters.
To use this indicator, you need to have the compiled indicator file bban...
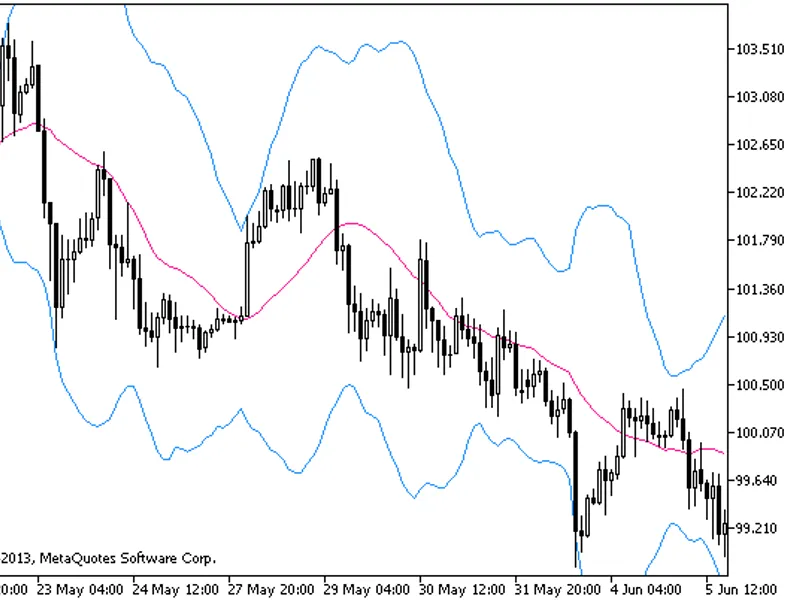
This is the BB-HL indicator.Indicator DescriptionThe BB-HL indicator is a variation of the standard indicator, using prices high and low instead of close for calculating standard d...
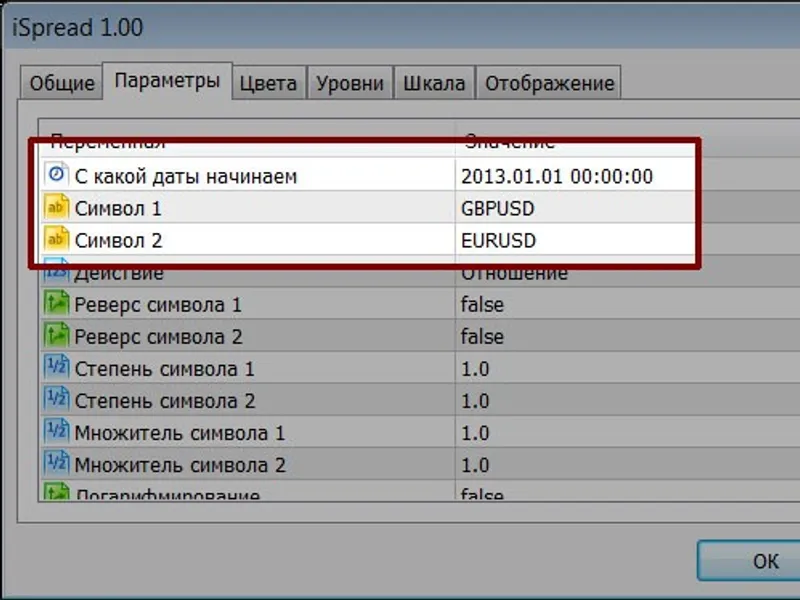
iSpread is an indicator designed to create synthetic symbols for pair trading strategies.Key Features and Configuration:Start Date- Define the starting date for building the synthe...
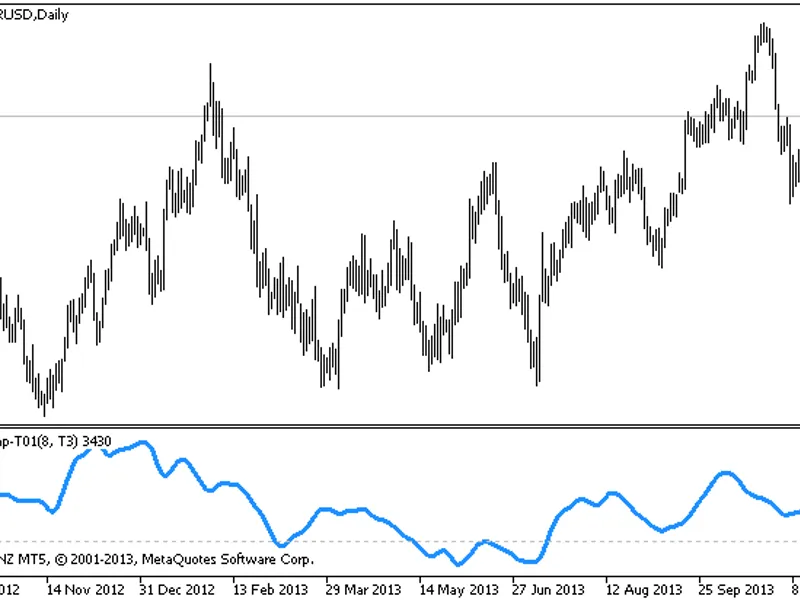
Homesoft-Tartan Corp.A Non-Normalized Trend Oscillator.This indicator was originally written in MQL4 and was first published on 27.09.2026.Figure 1. Indicator BWImp-T01...
The Blau Ergodic Signal indicator provides information about the current trend using indicator values from a fixed timeframe.The signal can be derived from either the indicator's h...
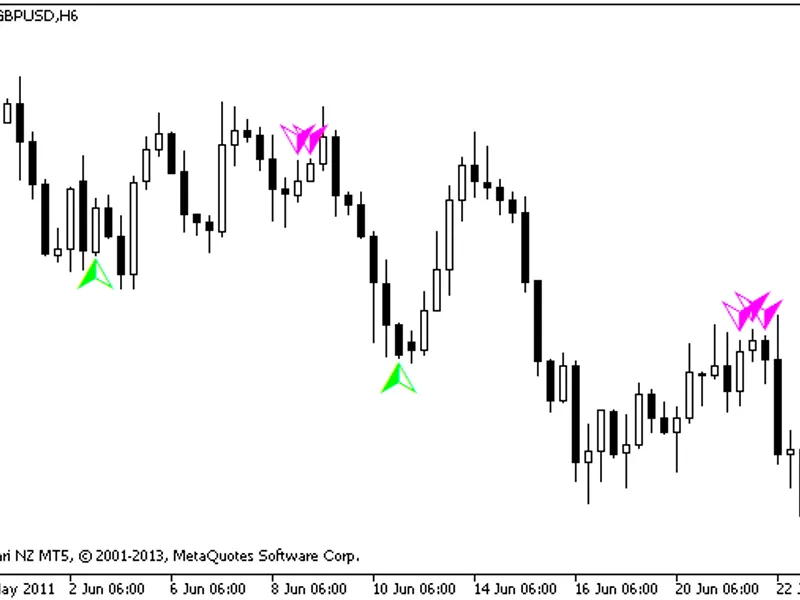
Semaphore Signal Indicator.The algorithm analyzes the last four bars.This indicator was originally written in MQL4 and first published on 27.09.2026.Figure 1. Semaphore Signal Indi...
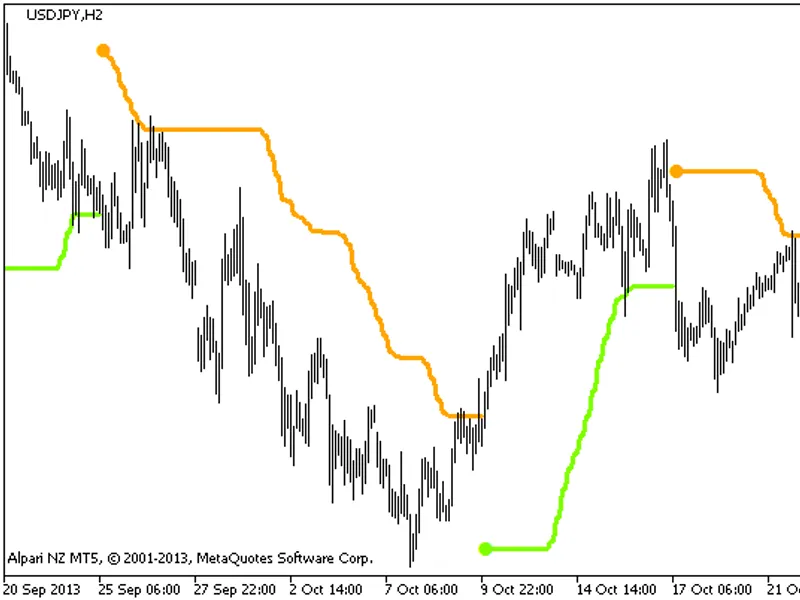
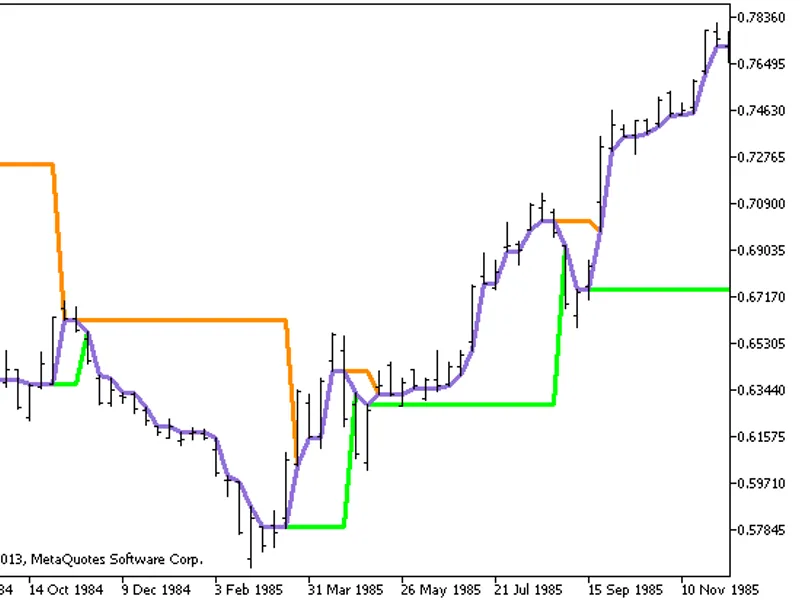
Trend indicator utilizing two colored lines to signify trend direction.The color of the upper line is determined by the price's position relative to a defined point.The color of th...
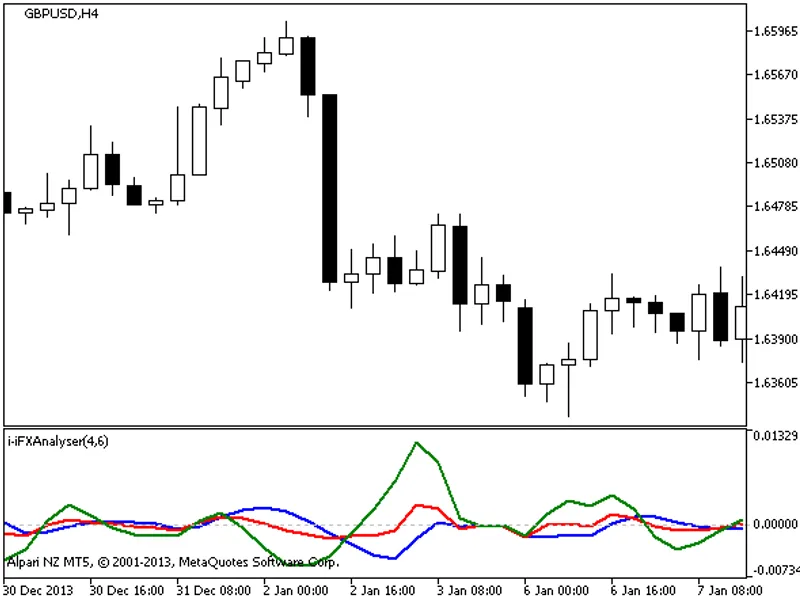
IFX Analyzer IndicatorThis indicator provides a straightforward visualization of three simple linear combinations derived from the differences between fast and slow moving averages...
Average Range IndicatorThis indicator displays a channel representing the middle range of price change.Originally developed in MQL4, it was first published on 25.09.2026.Figure 1. ...
A trend indicator featuring three lines.This indicator was originally developed in MQL4 and first published on 27.09.2007.Figure 1. Indicator dynamicrs_3clines...
The Blau SM Stochastic Signal indicator displays current trend information using indicator values from a fixed timeframe.Signals can be derived from either the histogram or the clo...
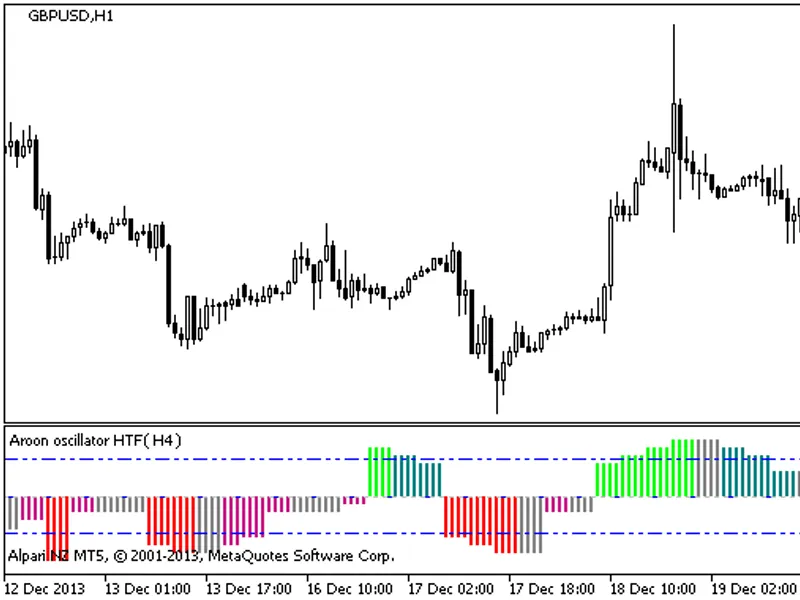
The Aroon Oscillator indicator is provided with a timeframe selection option available in the input parameters.
This allows for more flexibility in trading decisions.
Figure 1 di...
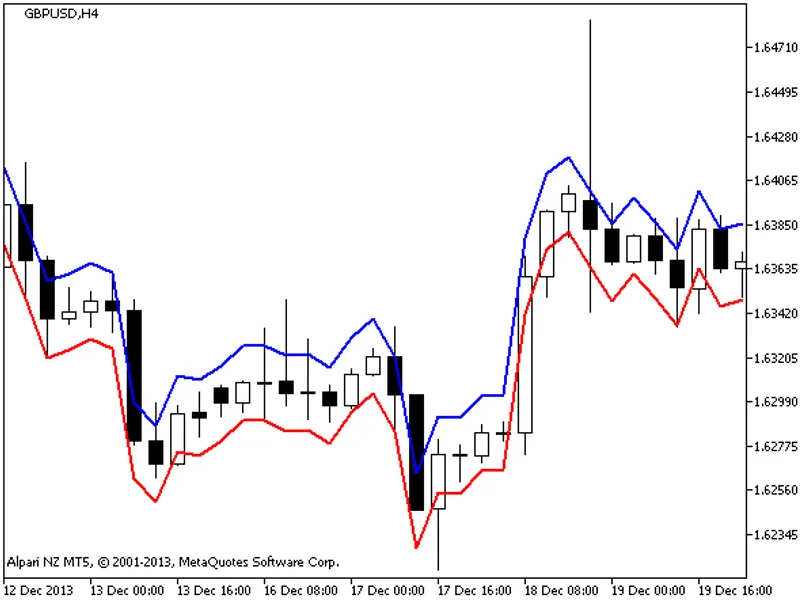
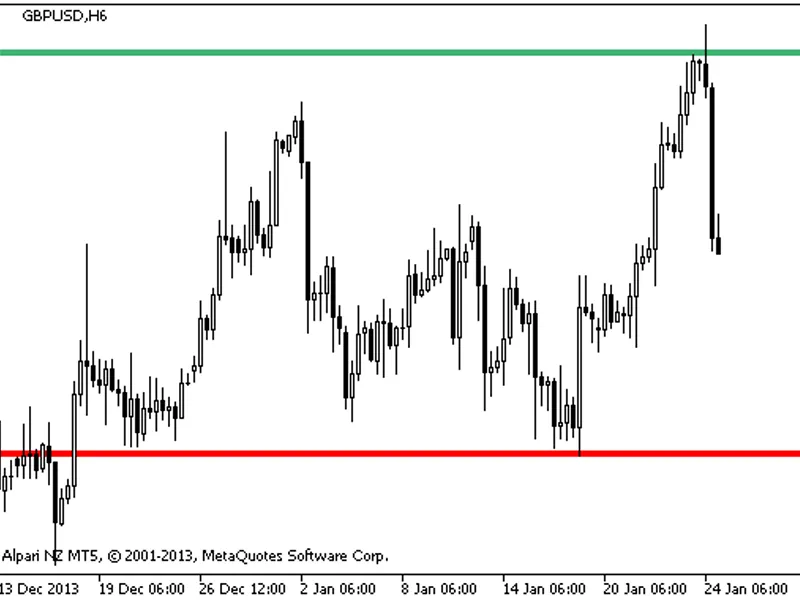
The indicator draws support and resistance lines, which are defined by the maximum and minimum for the last N bars.
Indicator input parameters:
This indicator was originally writte...
NX Bars is a semaphore signal indicator that provides predictive signals.The indicator displays the newest signal on a bar that is a defined distance from the current bar. This dis...
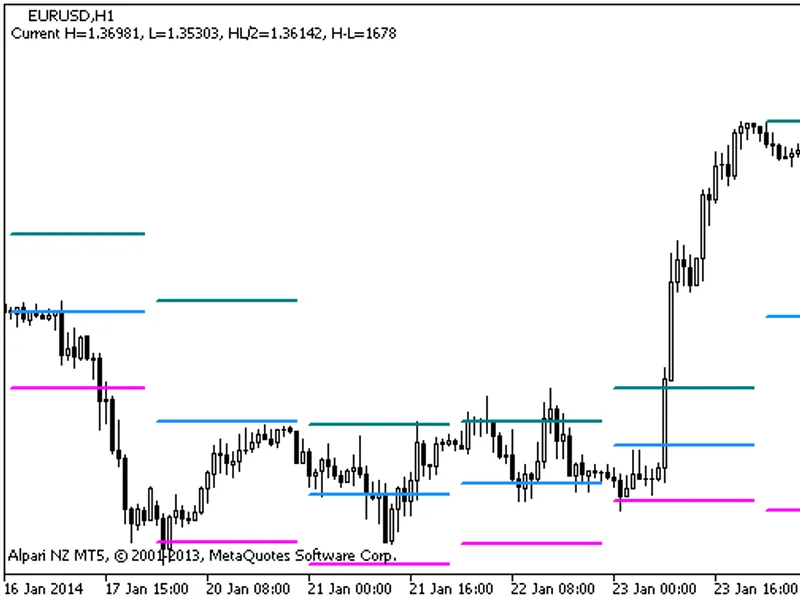
This indicator displays pivot levels, support levels, and resistance levels.Pivot, Support, and Resistance Indicator- Originally written in MQL4 and first published on 24.09.2026.-...
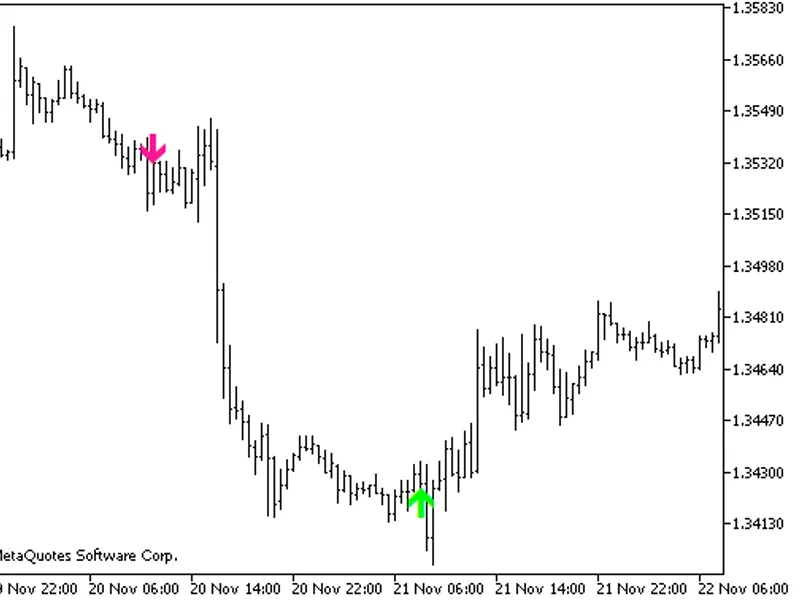
This indicator identifies Doji candlesticks and highlights them on the chart with colored arrows.The original version of this indicator was developed in MQL4 and first published on...