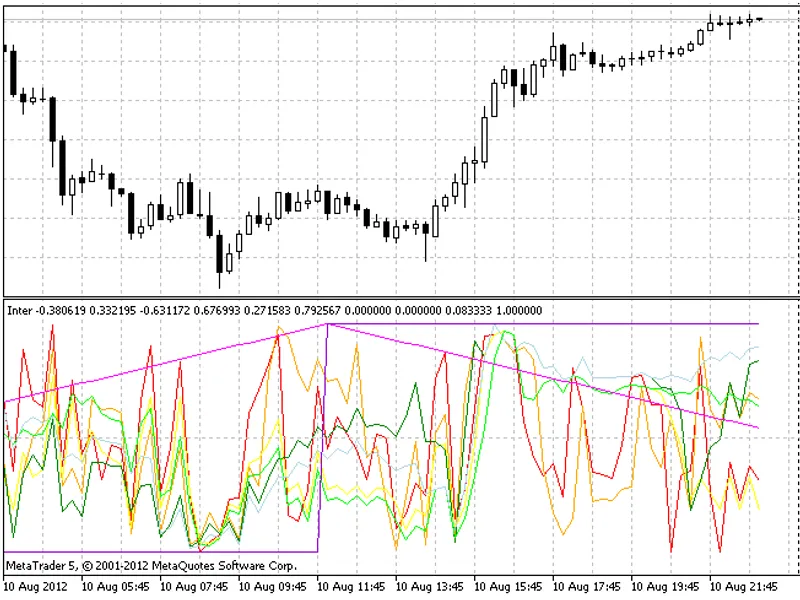
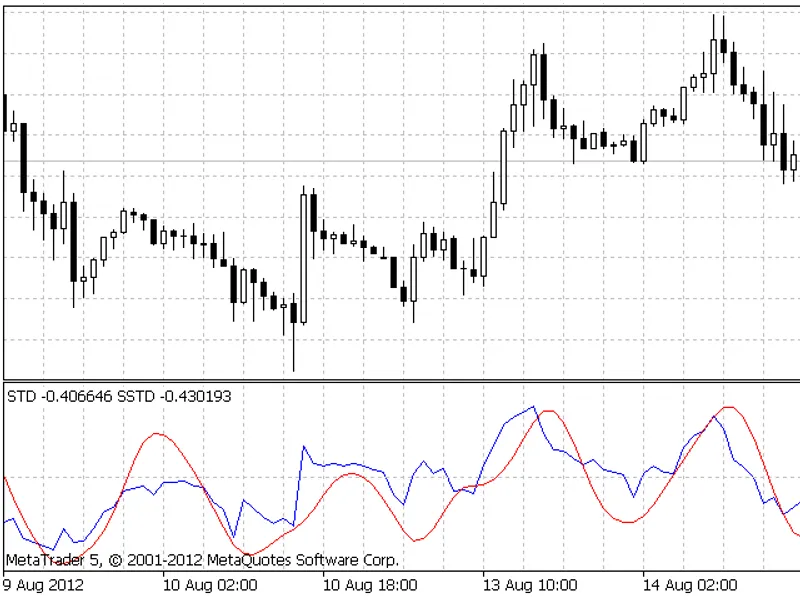
This indicator was designed to facilitate the acquisition of synchronized and normalized data for neural network inputs.Data synchronization is achieved based on the symbol where t...
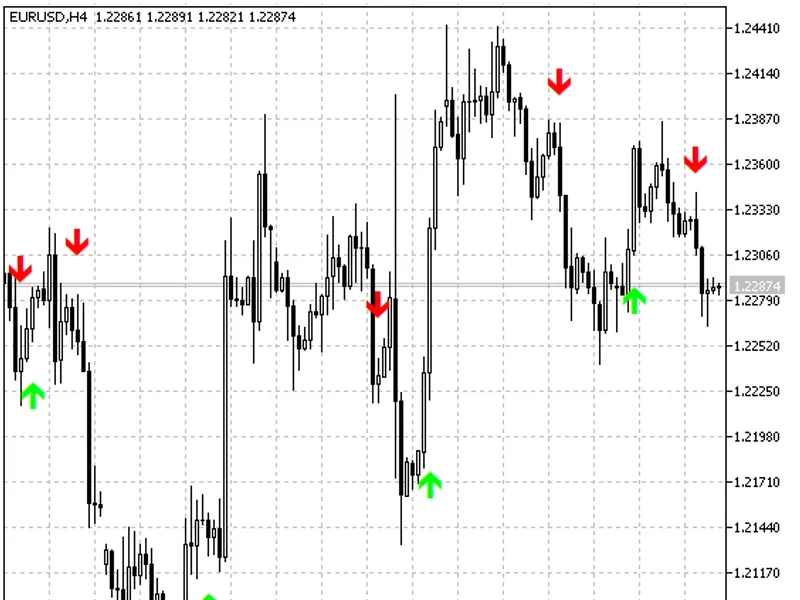
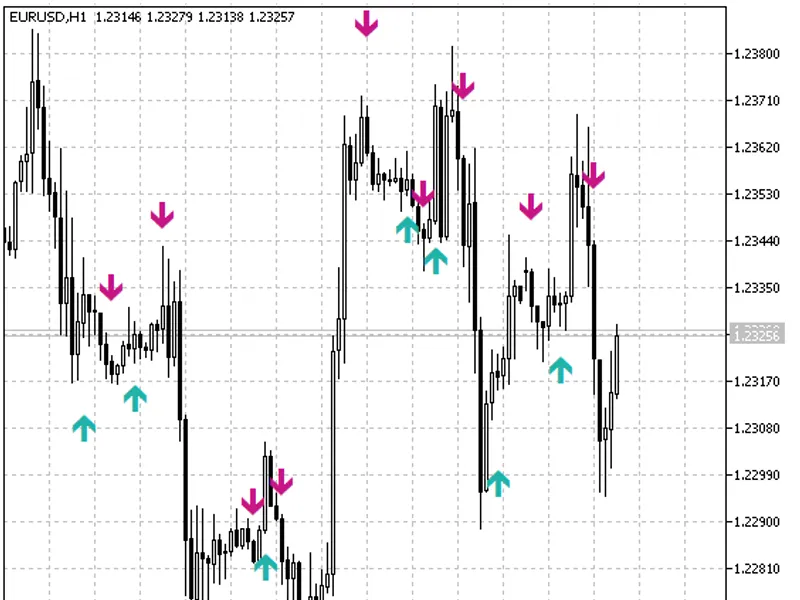
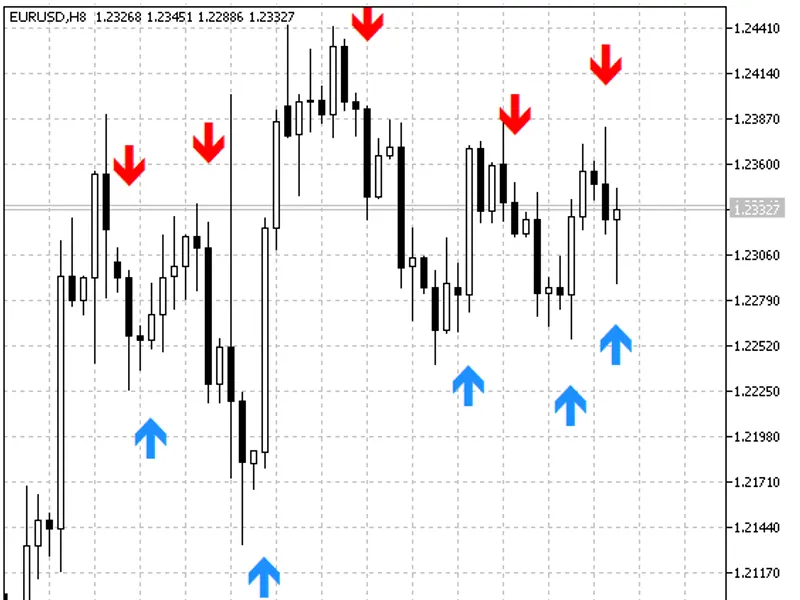
The simplest arrow semaphore indicator with alerts at the newest close bar. It offers the option to send signals to a mailbox, and these signals are based on the crossing of two mo...
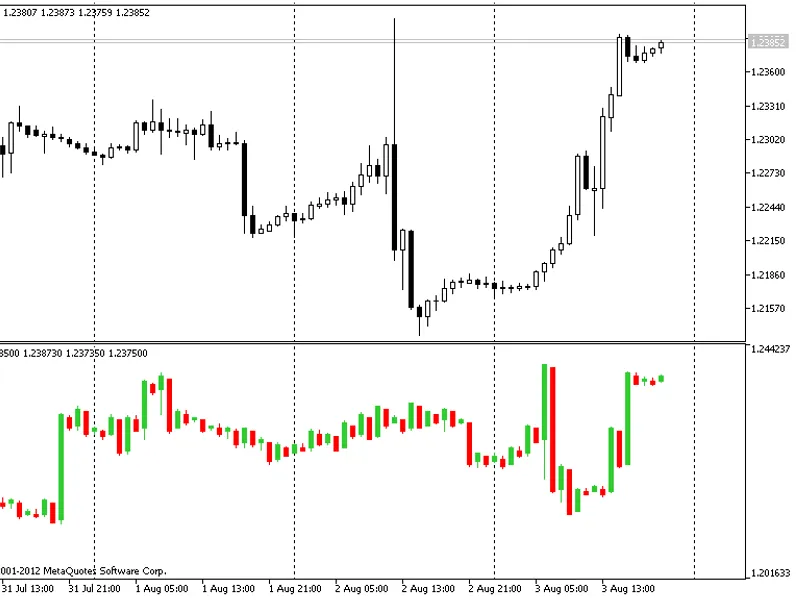
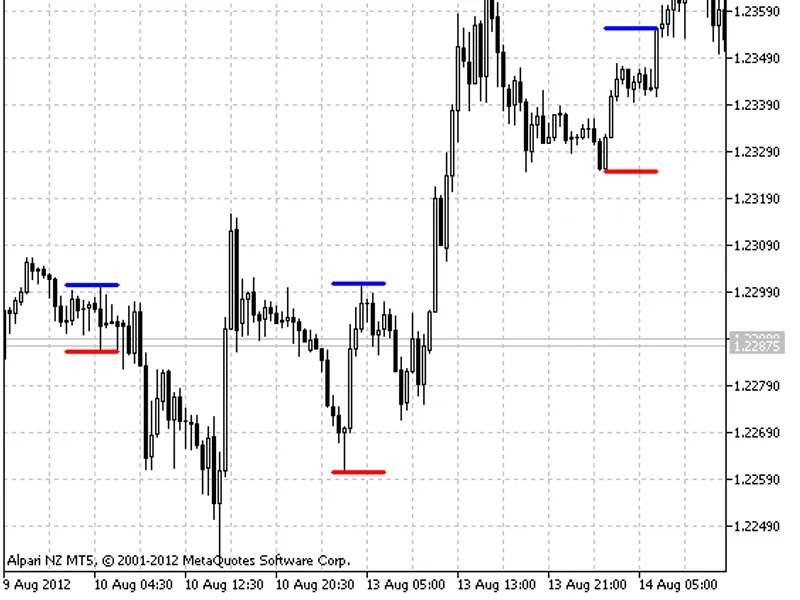
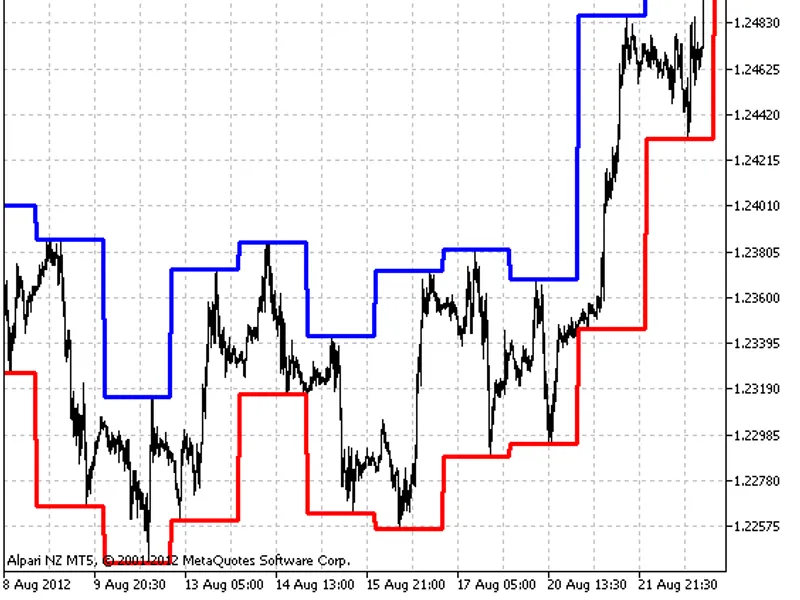
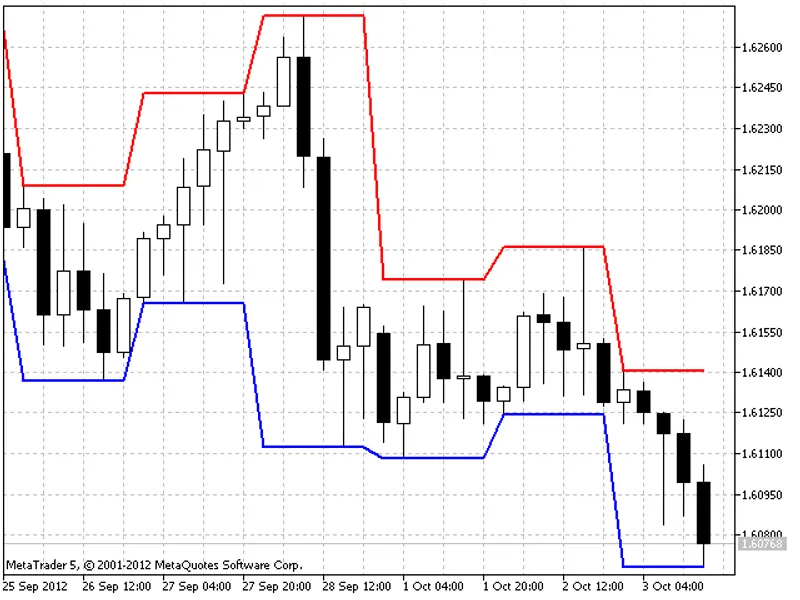
The indicator of the ranges of unrestricted time intervals.This is an intraday indicator displaying the height of trade ranges inside a trading day. The operation principle is as f...
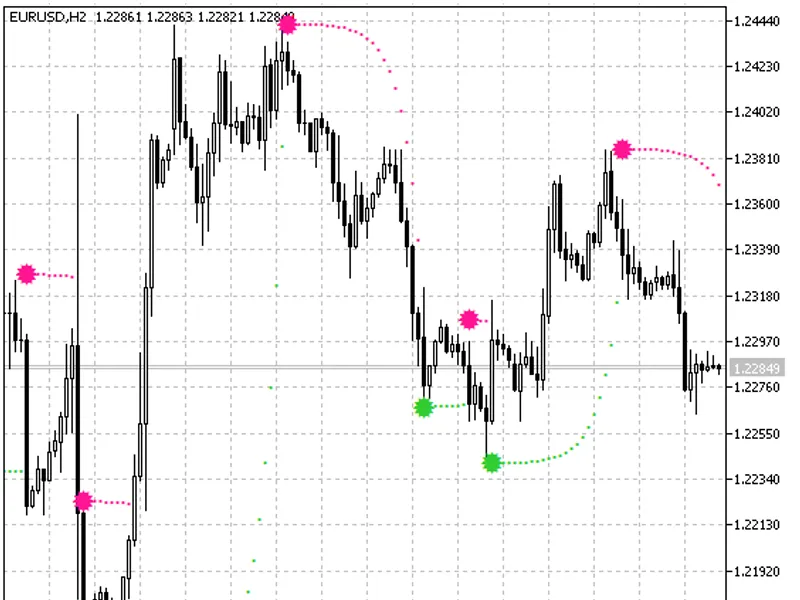
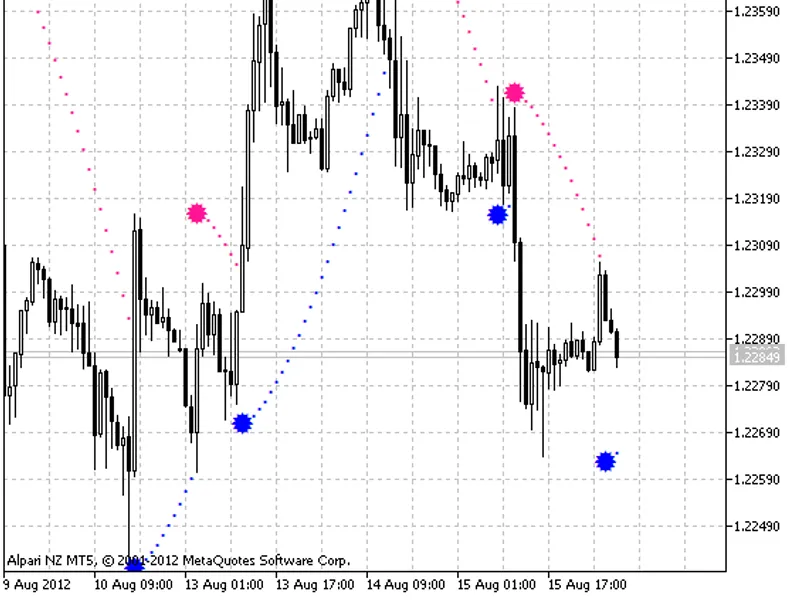
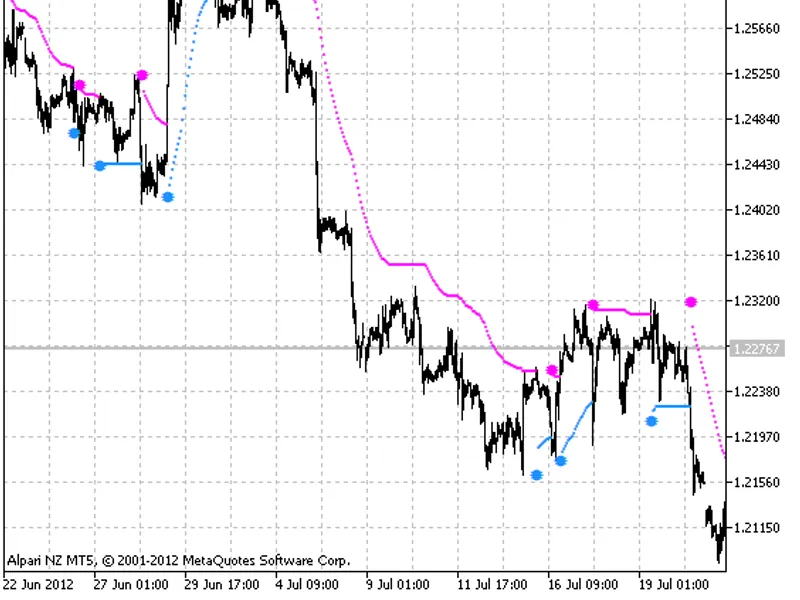
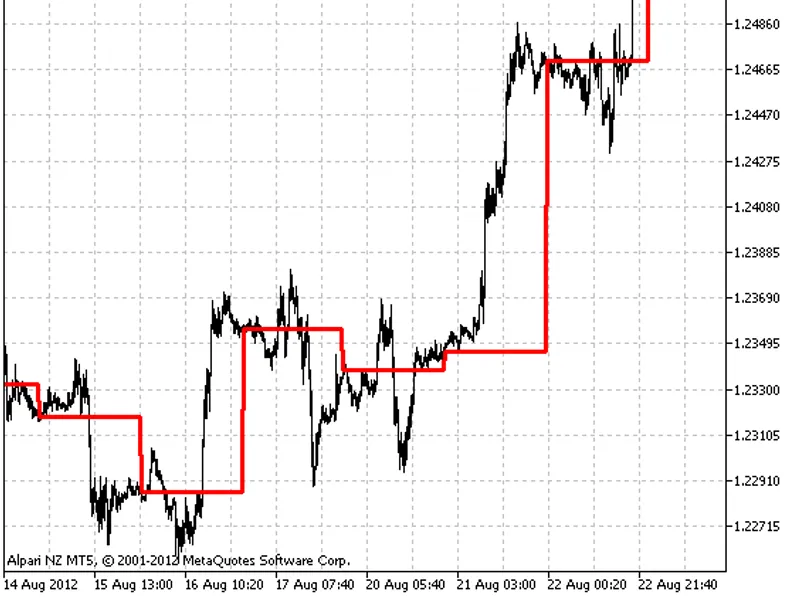
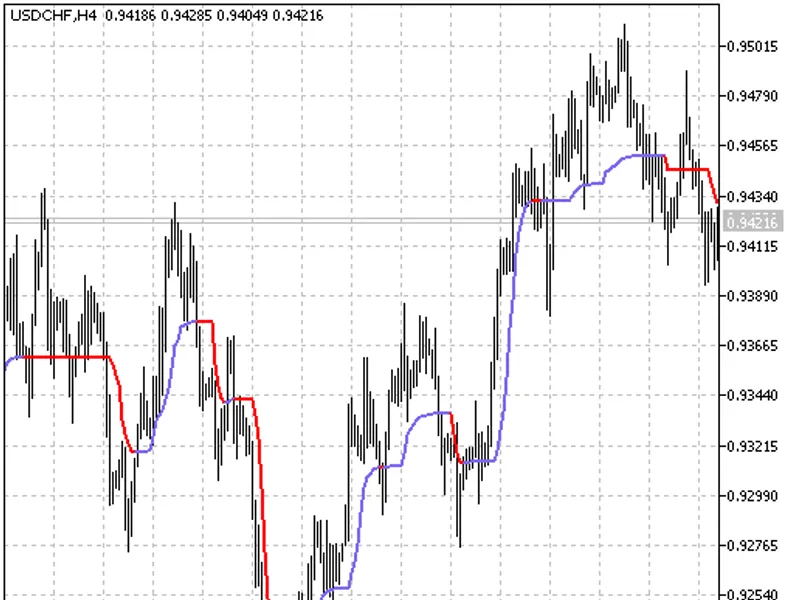
A simple trend indicator presented in the style of NRTR. It functions similarly to the Parabolic SAR.This indicator was initially developed for MQL4 and released in the code base o...
Simple trend indicator displayed in the form of NRTR. Its use is similar to Parabolic SAR.BrakeParb is an indicator that was first implemented in MQL4 and published in the code bas...
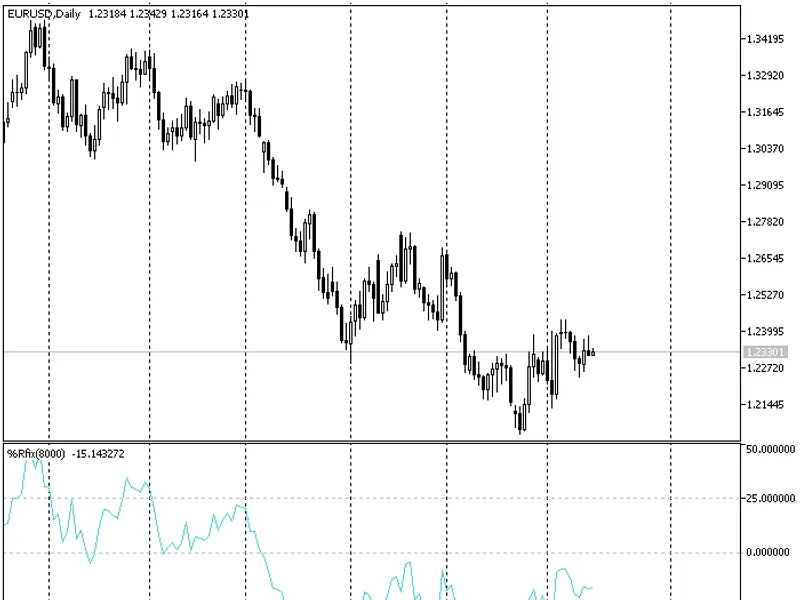
The WP Rfix indicator is a technical analysis tool designed for MetaTrader 4 and 5 platforms. It is calculated similarly to the Williams' Percent Range (WPR) indicator, but with a ...
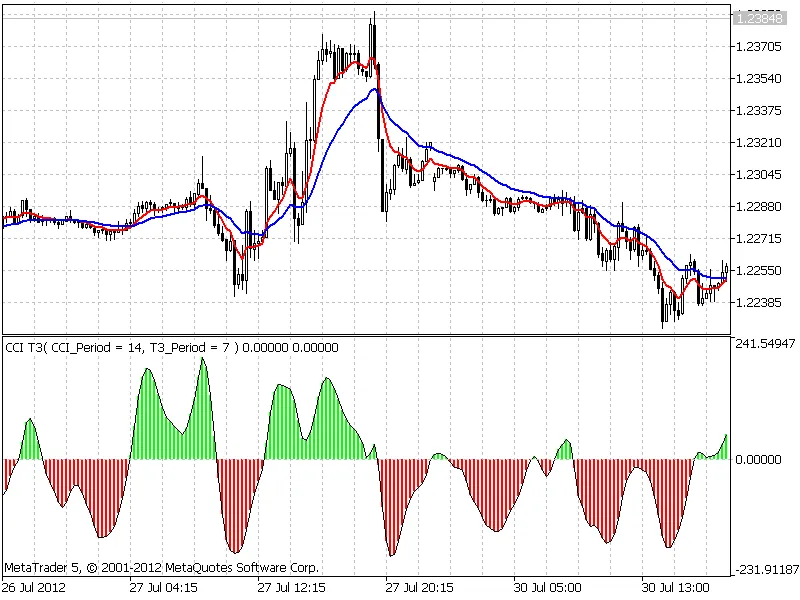
Standard Commodity Channel Index smoothed by the Tilson algorithm. This indicator employs an efficient calculation method, utilizing bar closing values.Tips:This indicator can be s...
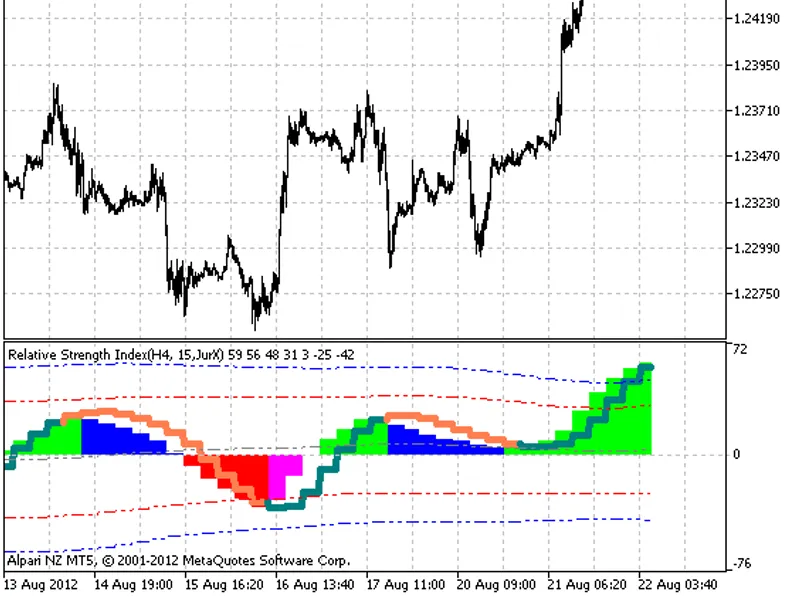
A 3-pole Butterworth filter is used for smoothing, originally designed by Witold Wozniak in 2026.This indicator is used similarly to RSI and DEM.Image:...
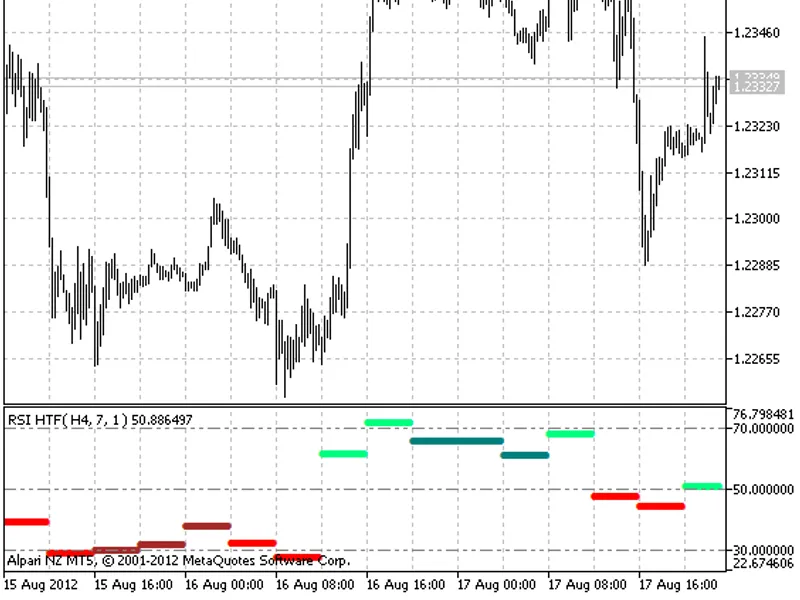
A standard indicator that can be applied to charts with different timeframes.The indicator colors ascending values above 50 in light green and descending values in dark green. Desc...
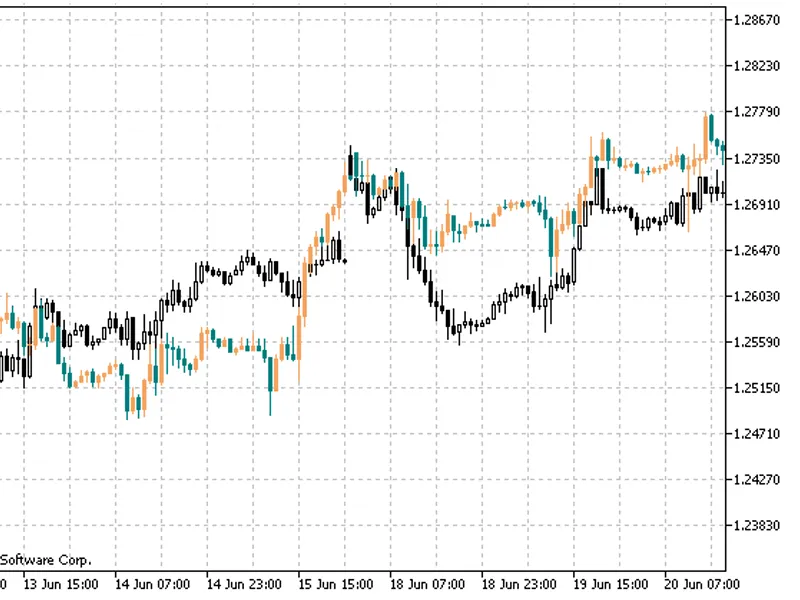
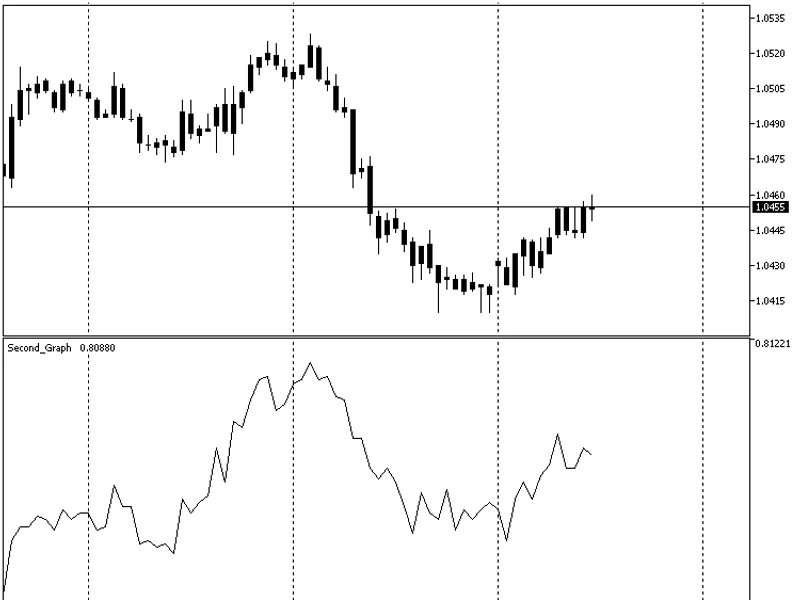
This indicator visualizes the pair trading method by overlaying charts of two financial instruments to identify divergences and potential trading opportunities.Fig. 1: Overlaying E...
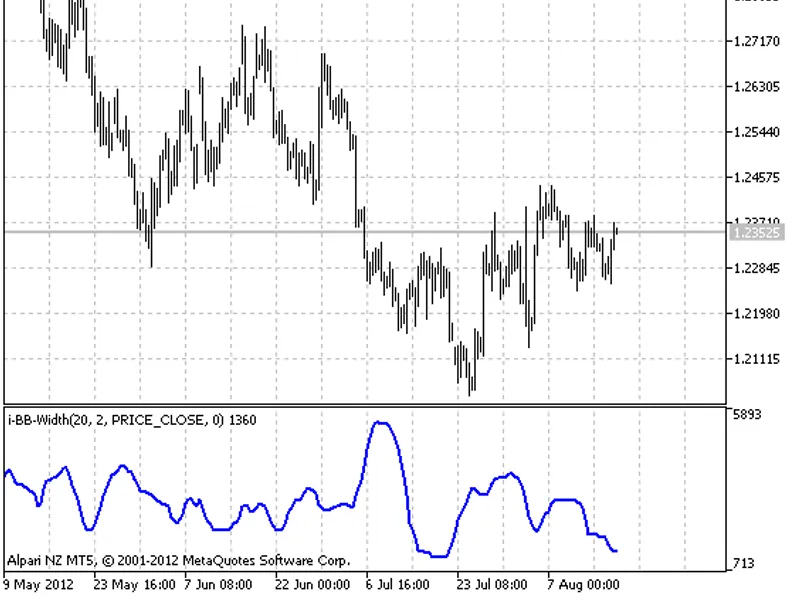
Bollinger Bands Width is an indicator with a specific application method described in Forex Magazine, July 2026, on page 47.This indicator was first implemented in MQL4 and publish...
This indicator is a variation of the RSI and DEM indicators, offering enhanced sensitivity.Its application is comparable to the aforementioned indicators.Image:...
Simple trend indicator displayed in the form of NRTR. Its use is similar to Parabolic SAR.BrakeMA is an indicator that was first implemented in MQL4 and published in the code base ...
This indicator provides a comprehensive set of smoothing methods for Average True Range (ATR) values, including SMA, EMA, SMMA, LWMA, and non-standard techniques. It also allows fo...
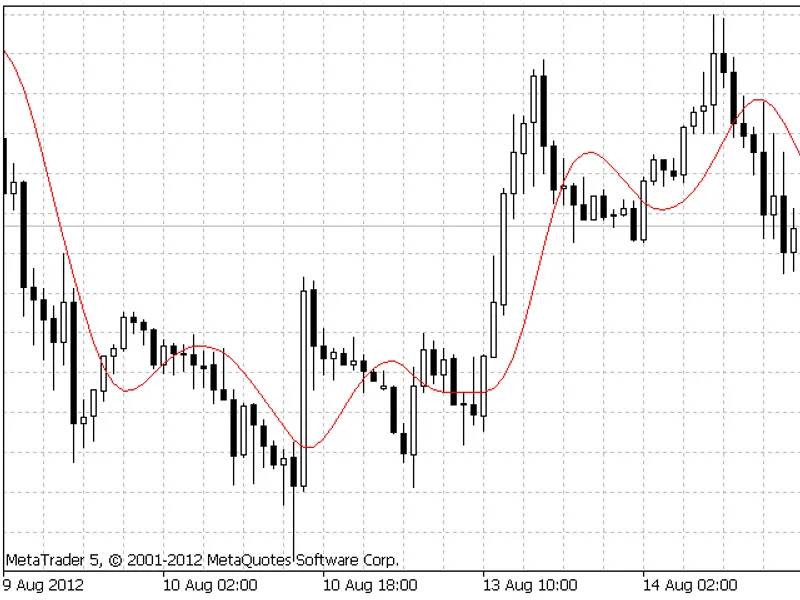
This indicator is a powerful tool for traders, offering a unique approach to price smoothing.Based on the Butterworth filter, it provides a 3-pole moving average that effectively r...
The RVI-Crossover Alert is a straightforward arrow semaphore indicator that offers alerts at the most recent close bar. It enables users to receive signals via email and push notif...
The RSI-Crossover Alert is a straightforward arrow semaphore indicator that offers alerts on the latest close bar. It enables users to receive signals via email and push notificati...
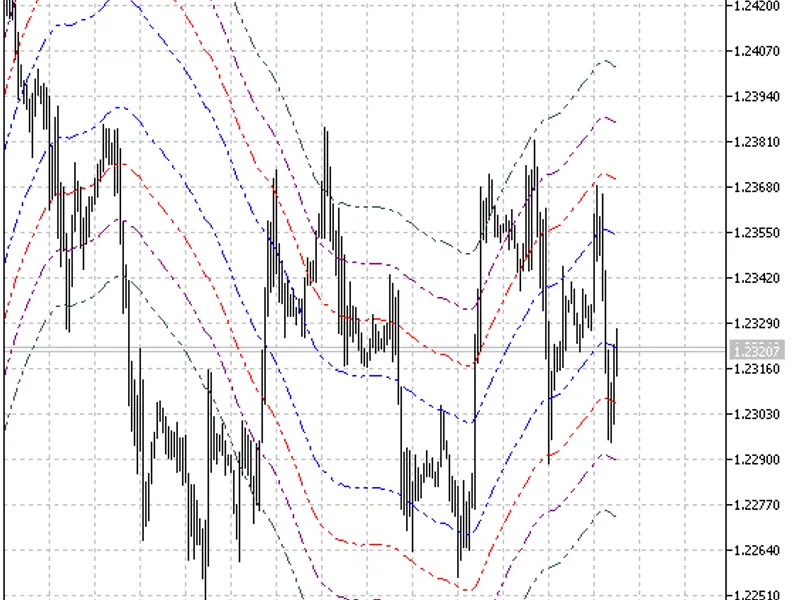
XLineRegression is an indicator that generates levels based on the linear regression algorithm.Input Parameters:- XLineRegressionThis indicator was originally implemented in MQL4 a...
The main difference of this indicator from its standard equivalent is the ability to change the smoothing algorithm by selecting from ten available options:- Simple Moving Average-...
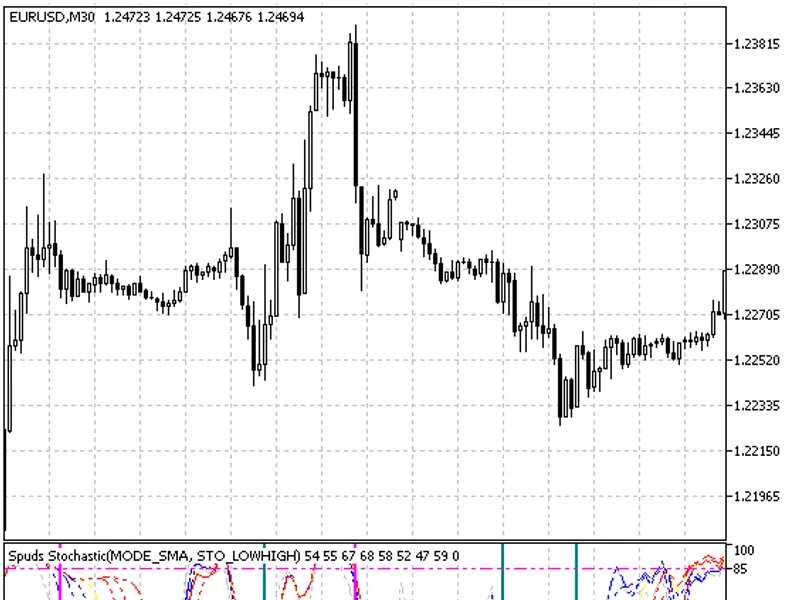
The indicator contains 8 stochastic oscillators. The default value of the "slow" and "period %d" parameters is 3, and %k varies from 6 to 24. This results in 8 stochastics with the...
This indicator facilitates the simultaneous analysis of multiple symbols on a chart.Key Features:- Analyze two or more symbols at once.- Utilize the first visible chart bar as the ...
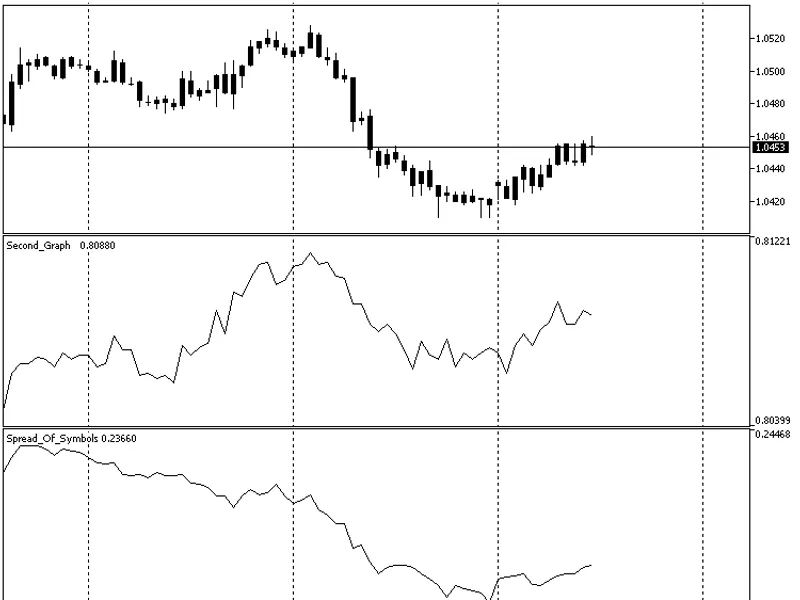
This indicator calculates and displays the price difference between two trading symbols as a chart.Indicator Input Parameters:- symbol1 and symbol2: Symbols for price difference ca...
Description:Upon launching the indicator, specify the required symbol for display ("symbol1" parameter) in the input parameters. The default setting is EURUSD. Multiple instances o...
The indicator displays the high and low levels of a specified day on any timeframe. When the 'dayshift' input parameter is set to zero, the indicator recalculates all data within t...
GeokomThis indicator displays the day's open level on any timeframe.Originally implemented in MQL4 and released in 2026, this tool provides valuable insights for traders....
The indicator is designed for trend trading. It opens a position when the lines intersect, and a steady convergence of the lines signifies a weakening trend.This indicator combines...
This indicator offers a comprehensive set of moving averages and smoothing algorithms, providing a versatile tool for technical analysis.Moving Averages:- Simple Moving Average (SM...
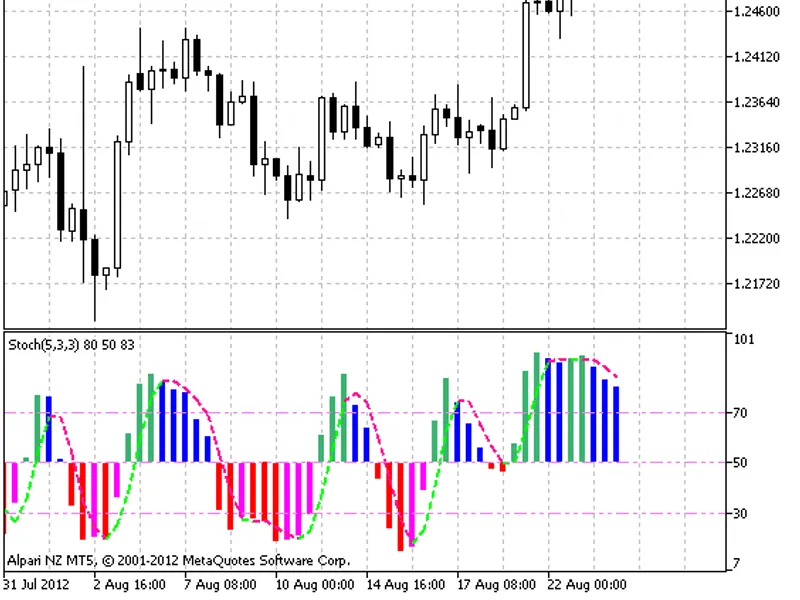
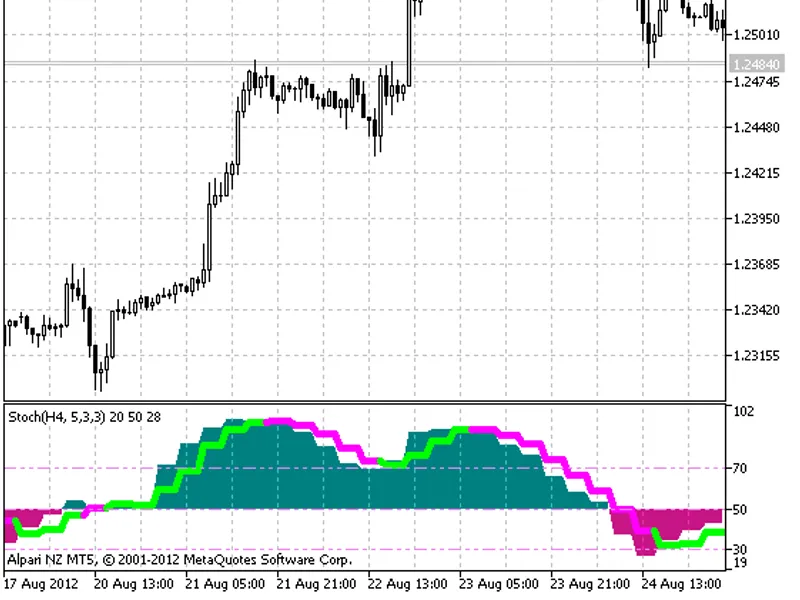
This indicator displays the standard stochastic as a color-coded histogram relative to level 50. The color scheme provides a visual representation of market trends:- Rising histogr...
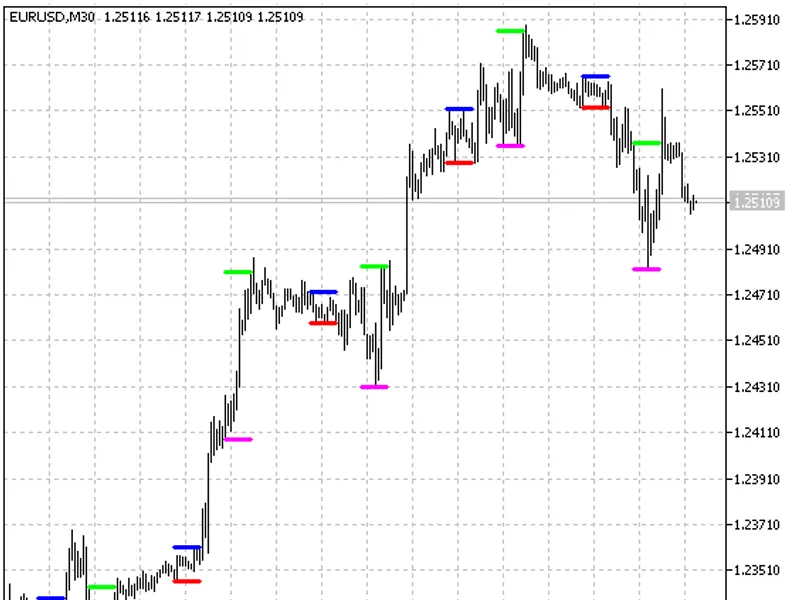
The i-Any Range2 indicator is a versatile tool for analyzing two unspecified time intervals.It is designed for intraday trading, providing insights into the trading range within a ...
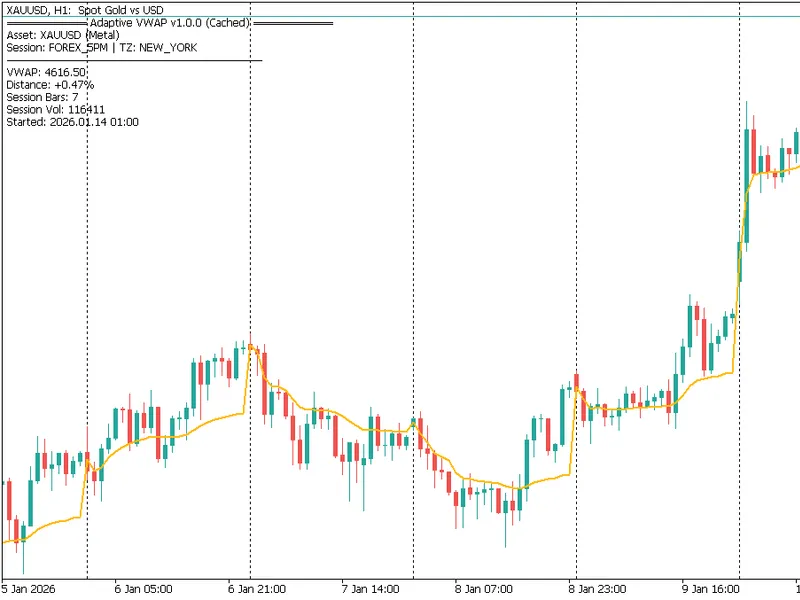
Adaptive VWAP Institutional v1.0.0A high-performance volume-weighted average price (VWAP) indicator for MetaTrader 5, tailored for high-frequency trading (HFT) and professional ass...
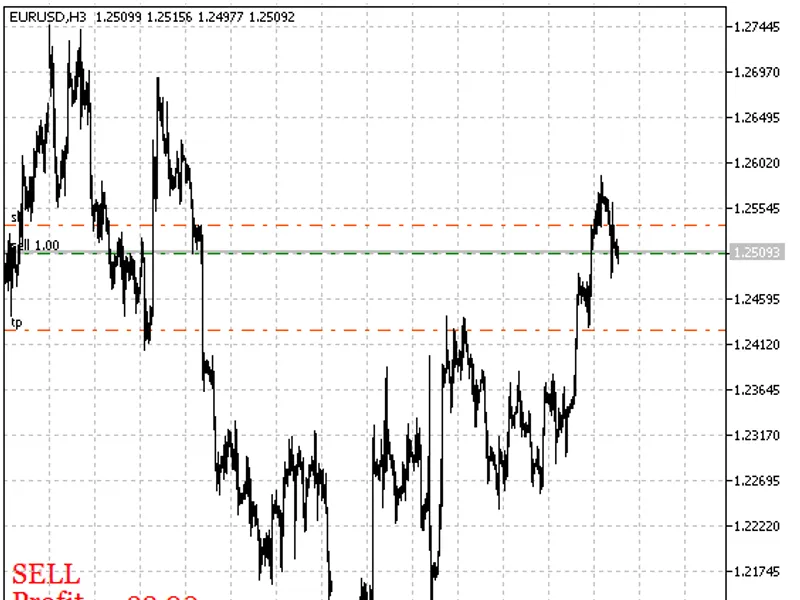
This indicator displays relevant information about a position opened on the current chart within the chart window. It includes the position direction, profit in points, and distanc...
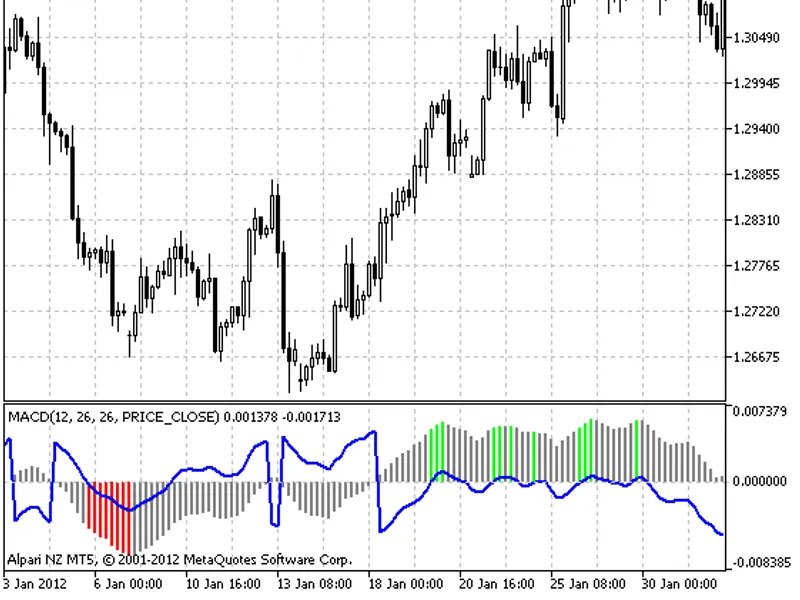
svinozavrThis indicator is straightforward. When the MACD is in a positive area, its values are shifted downwards by the amount of ATR. Conversely, when the MACD is in a negative a...
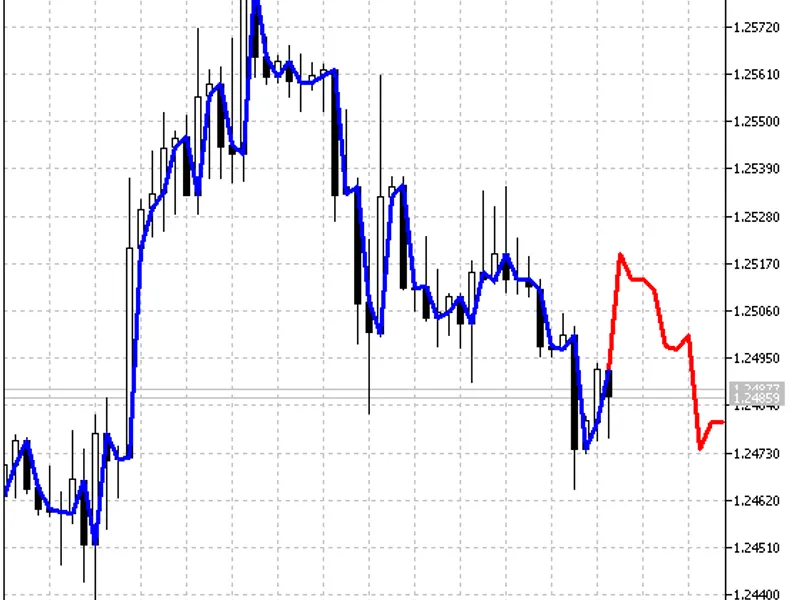
This is a unique indicator designed to forecast price movements for a specific number of bars ahead, as defined by the 'drawshift' input parameter. It's important to note that the ...
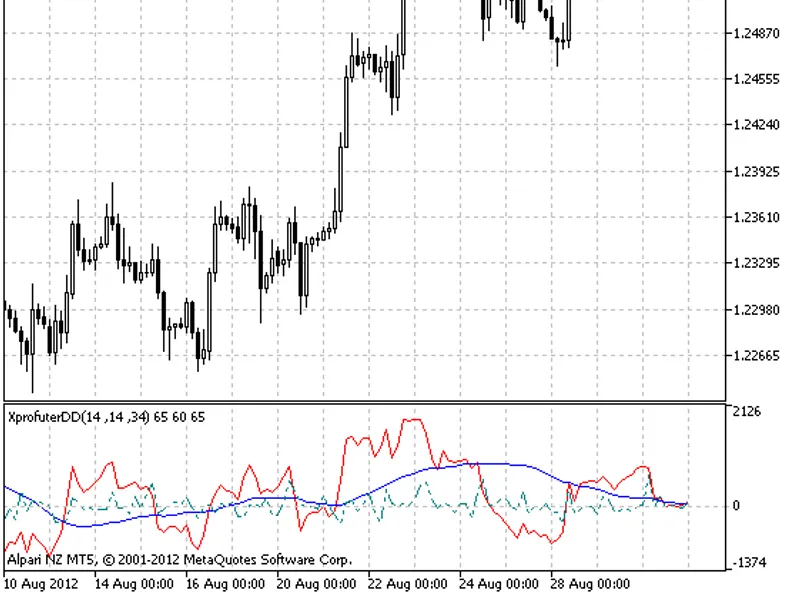
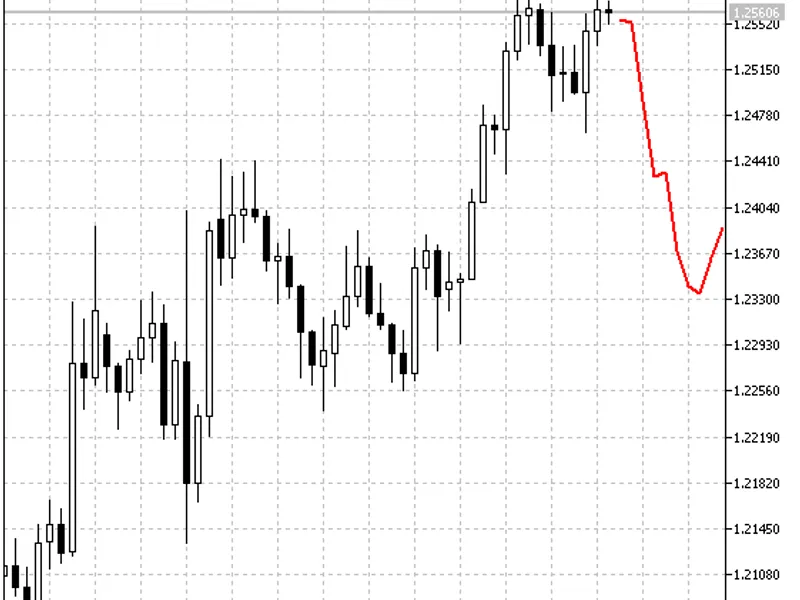
An indicator that predicts the future price movement on the Forex market.Xprofuter Overlay displays a line indicating the potential price trajectory.While forecasting market trends...
This indicator calculates and displays the daily highest and lowest prices as two sets of lines.It demonstrates the practical application of specific functions and the MqlDateTime ...
The indicator displays the current reference prices of the market state, aiding in identifying flat market conditions.It utilizes a technique called Fractal Smoothing (FRAMA), whic...
Maxaxa Angry HunterThe Bubbles and Drops indicator is a unique tool that leverages the concept of environmental disturbances and their resulting waves to predict price movements.It...
The indicator is based on the Commodity Channel Index (CCI) and incorporates Tilson's ratio. It is designed to provide a clear visual representation of market trends and potential ...
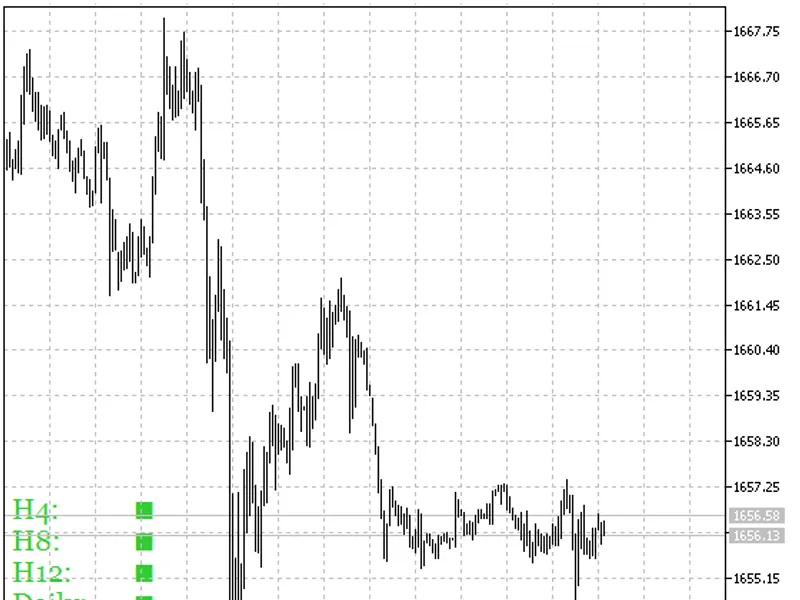
The Candle Trend indicator is a powerful tool that visualizes price trends across multiple timeframes. It provides a comprehensive view of the market's direction by analyzing six d...
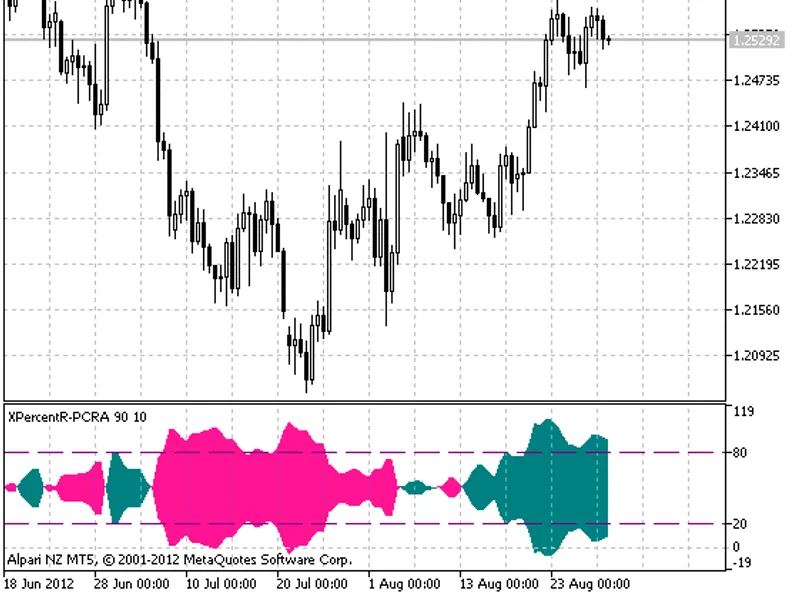
The XPercent R-PC R indicator is a simple oscillator displayed as a colored cloud, where the color indicates the trend direction.Indicator Input Parameters:- Simple Moving Average-...
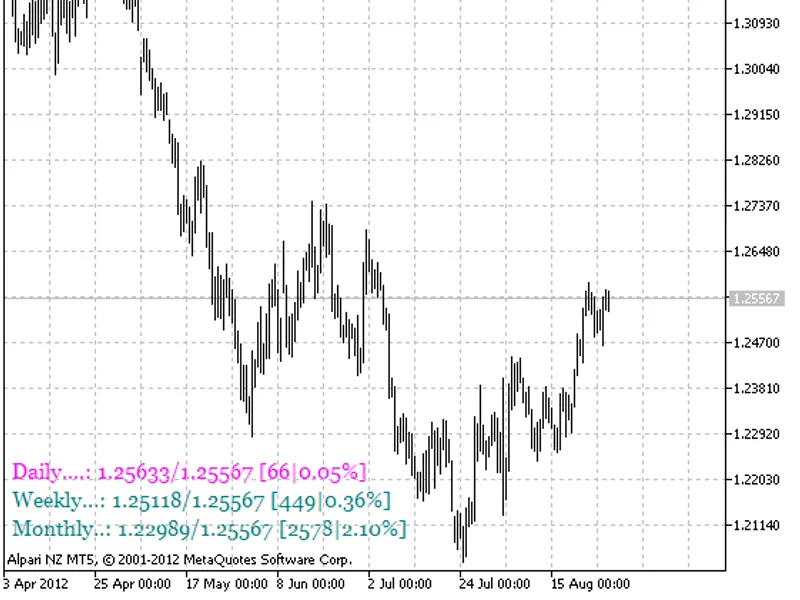
Percentinfo provides valuable insights into price movements, offering information on the rise and drop in prices as a percentage and in points. This indicator sources data from the...
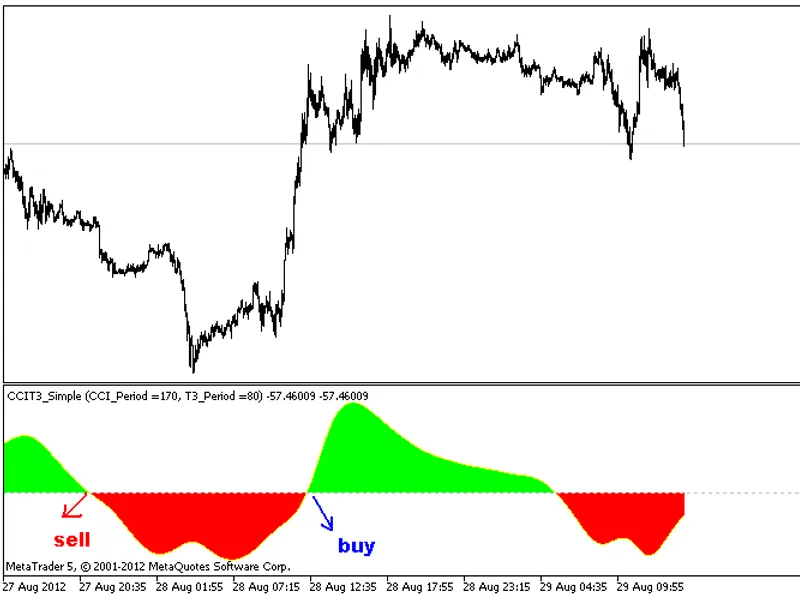
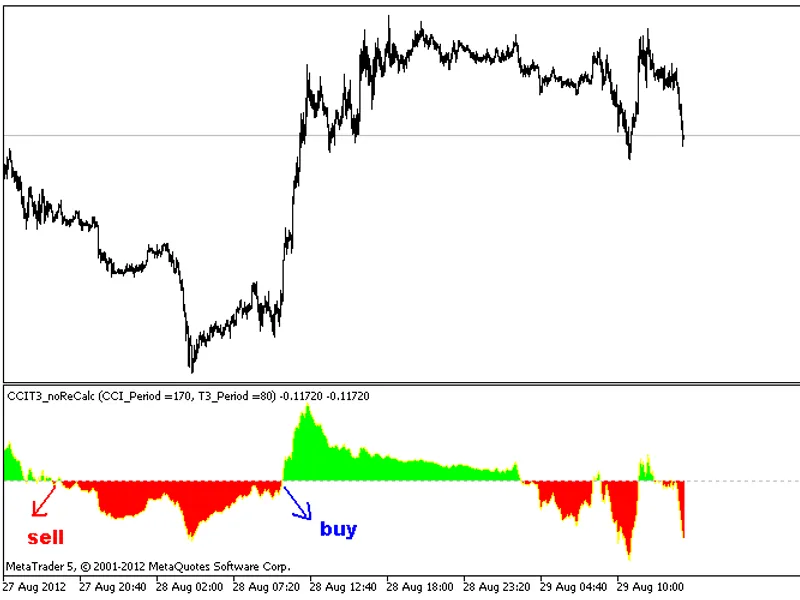
The ccit3_simple indicator has been modified to address a limitation on the number of calculated bars (max_bars_calc=100000). This indicator is a fundamental component of the exper...
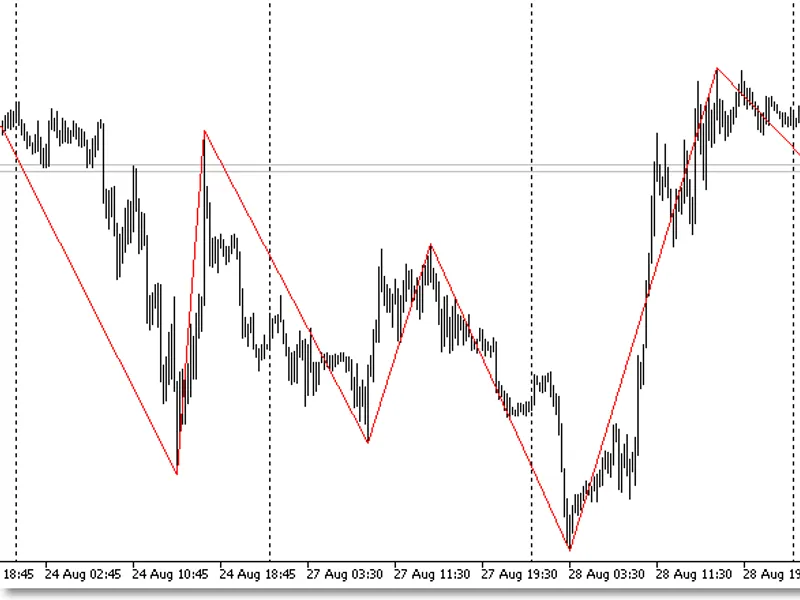
FastZZ is a highly efficient and rapid zigzag indicator. It provides a comprehensive 'picture' of market trends while outperforming its counterparts in terms of speed and cost-effe...
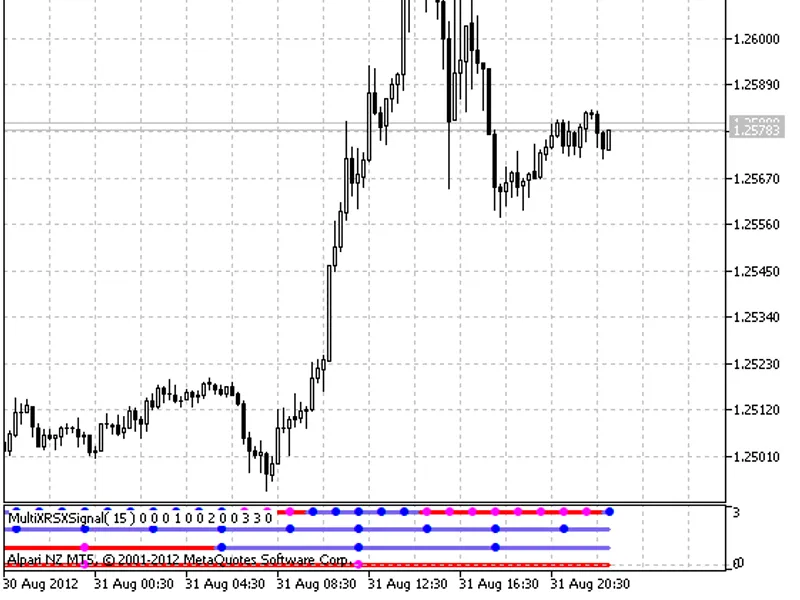
MultiXRSXSignal displays information on current trends using values of four indicators obtained from different time frames.Each indicator corresponds to one of the four lines of th...
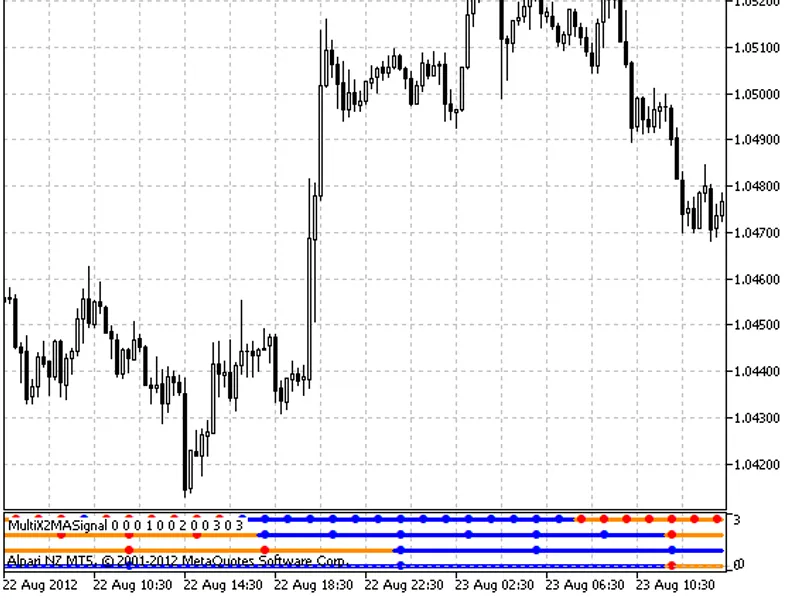
MultiX2MASignal displays information on current trends using values of four indicators obtained from different time frames.Each indicator corresponds to one of the four indicator l...
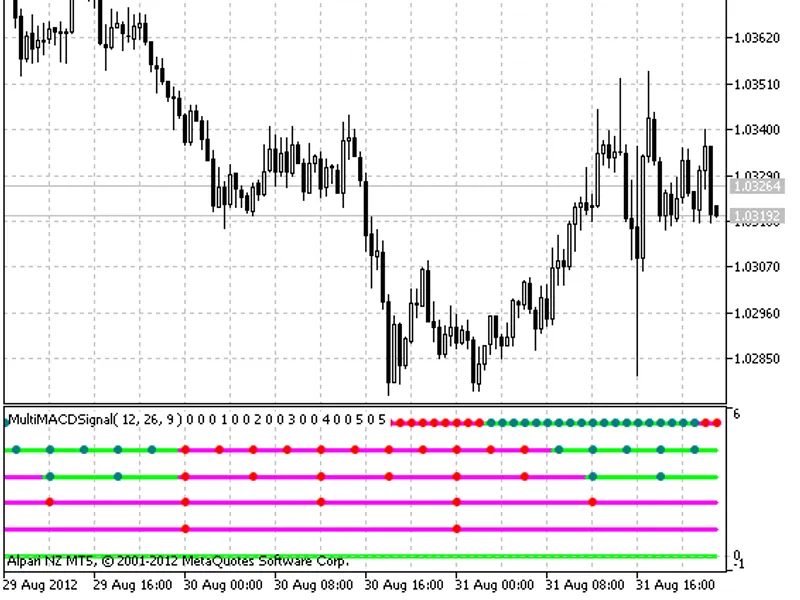
MultiMaCDSignal provides insights into current market trends by utilizing values from six indicators across various time frames.Each of the MACD indicators is linked to one of the ...