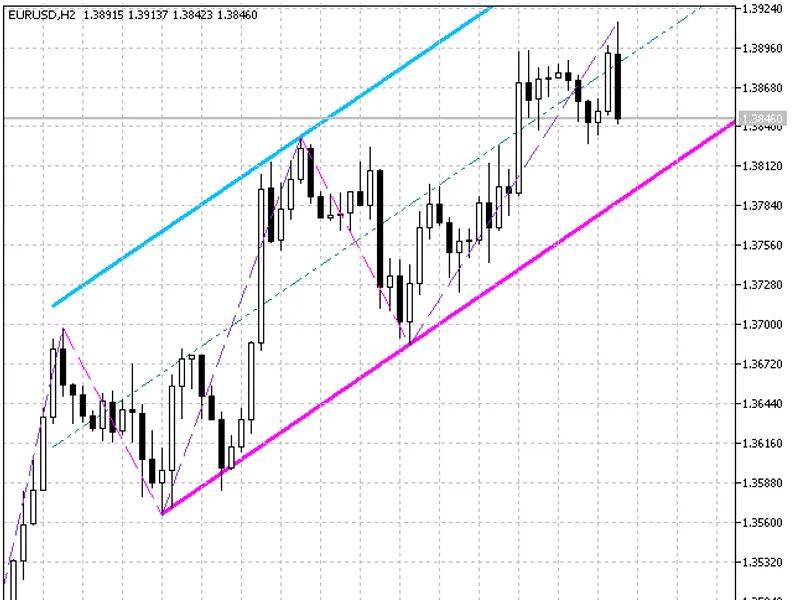
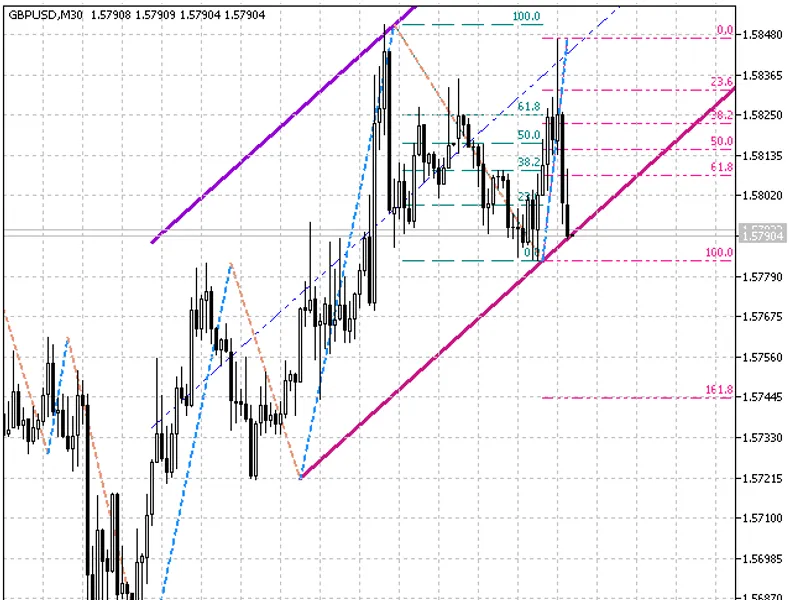
This indicator constructs a channel using three extreme points of the Zig Zag pattern.Indicator DescriptionThe channel is built based on the Zig Zag extreme points, providing a uni...
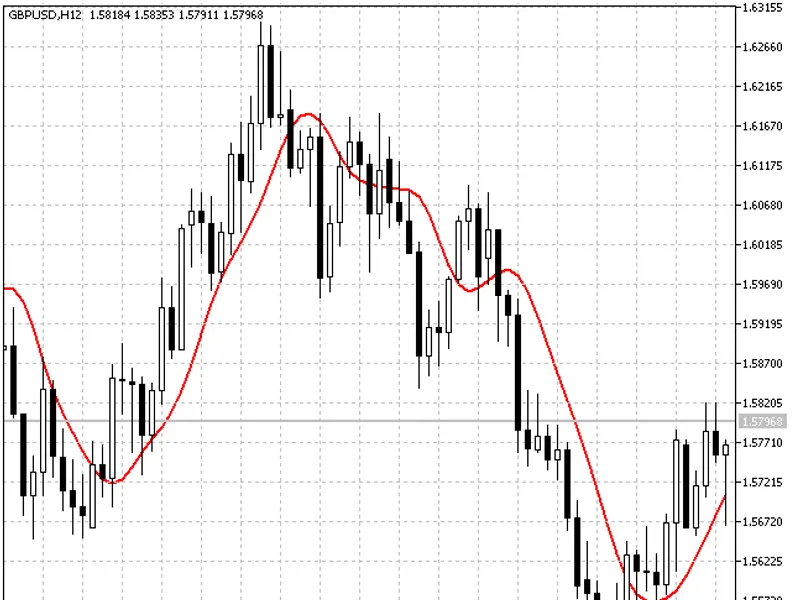
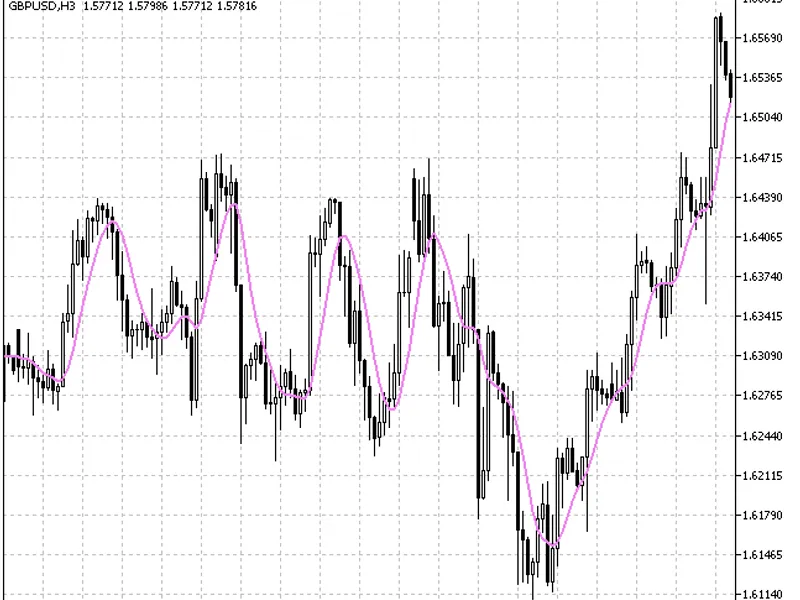
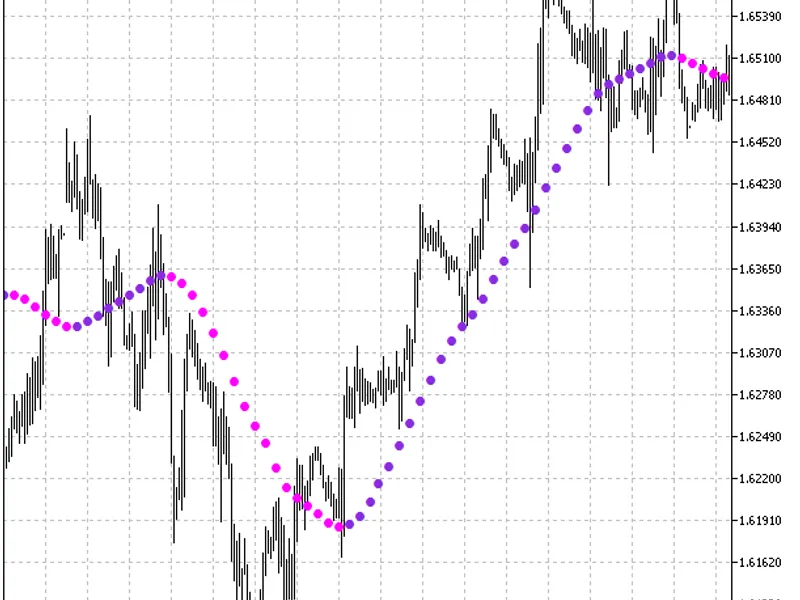
This implementation utilizes a two-pole Butterworth filter for smoothing calculations within a moving average algorithm.The filter is detailed in the technical literature by John E...
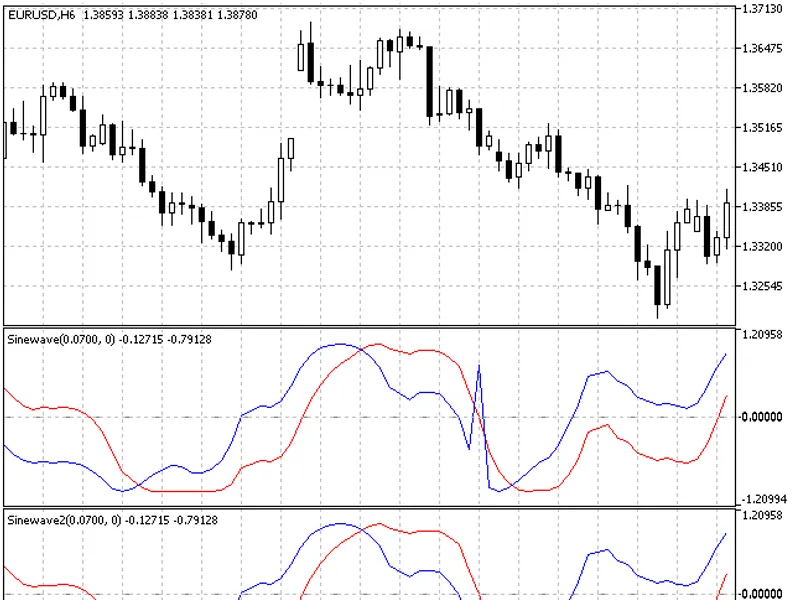
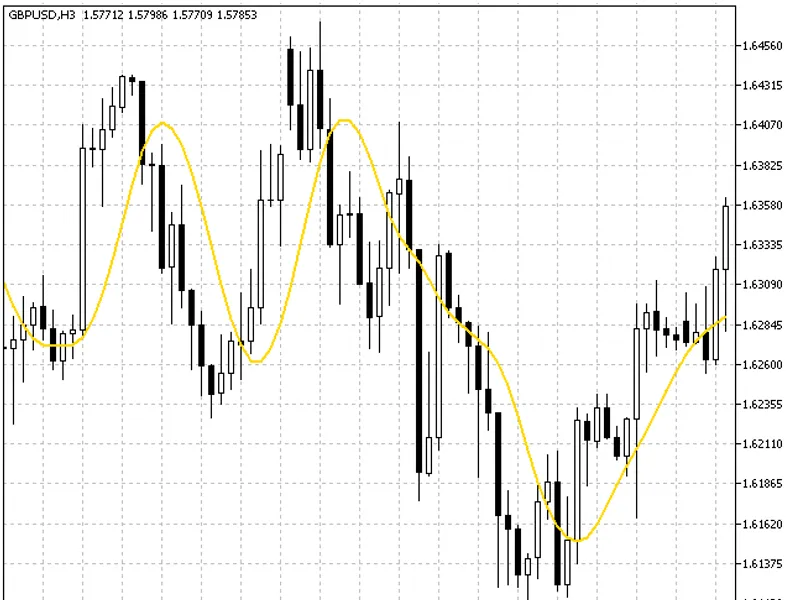
The Sine Wave indicator was developed in 2026 and is based on the idea of economical processes periodicity. It detects violations of this periodicity. The indicator acts in a compl...
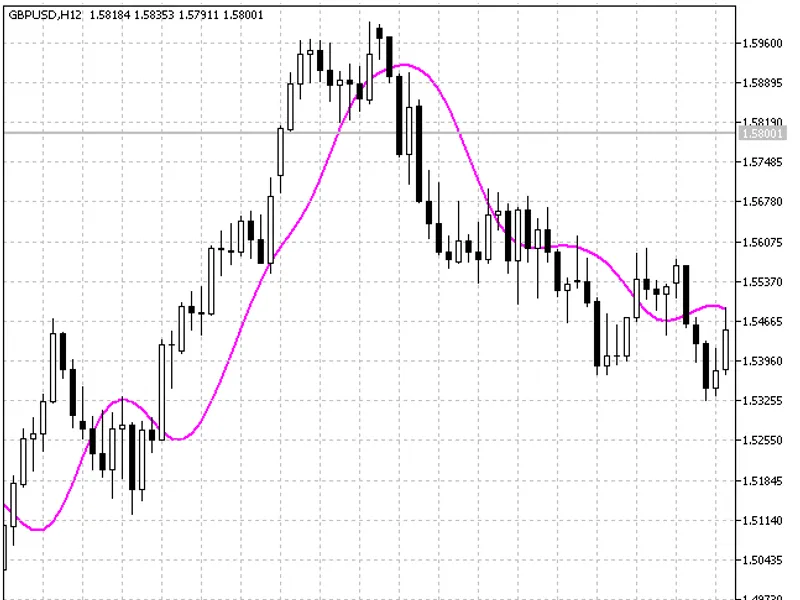
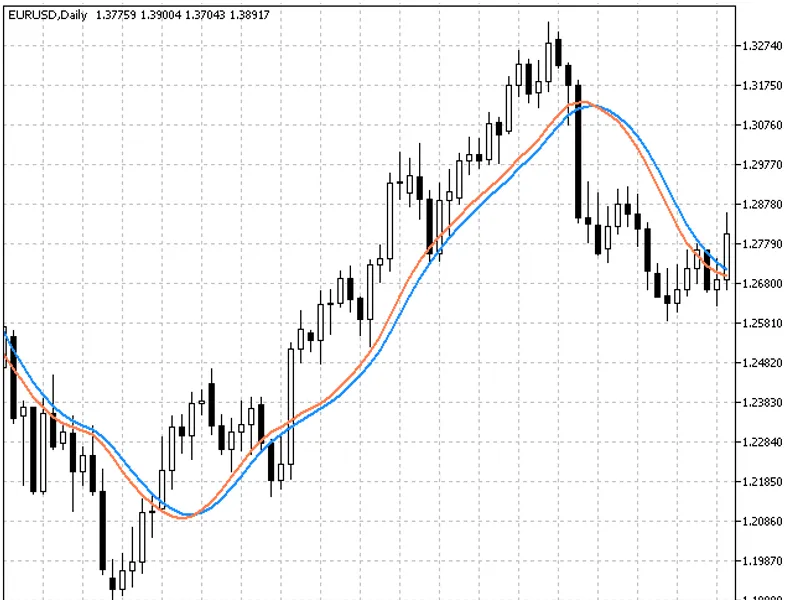
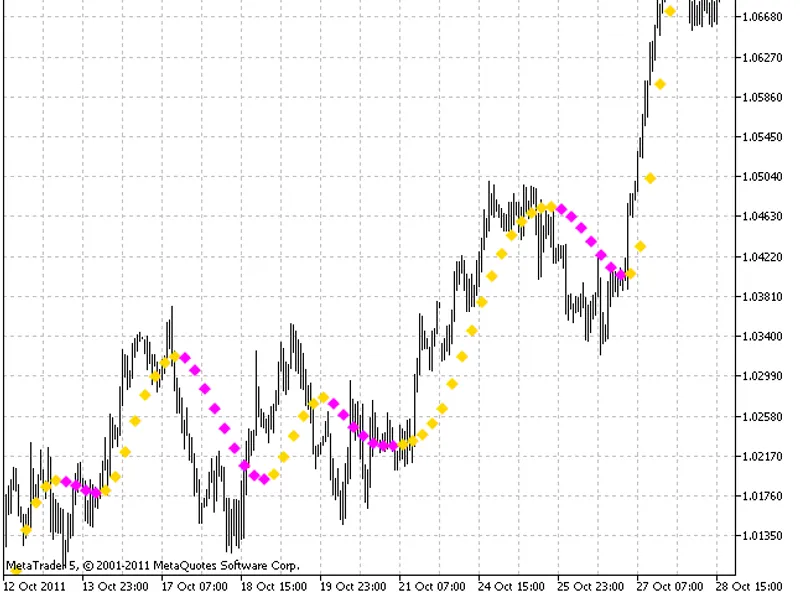
A three-pole Butterworth filter is employed for smoothing within this moving average calculation algorithm.The filter is detailed in John Ehlers' publication.This implementation ut...
This indicator displays the current market price in one of the corners of the chart.Indicator OverviewThe indicator shows the current price in one of the chart corners.It was first...
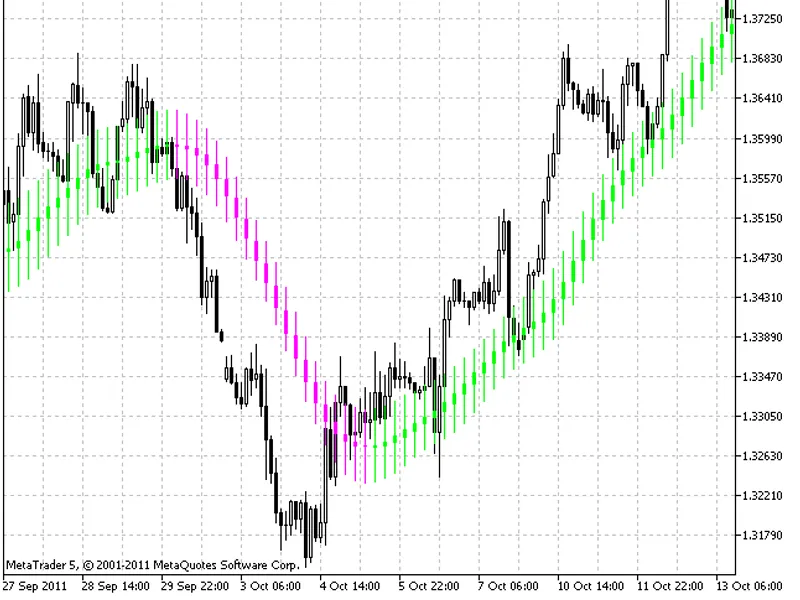
The indicator displays averaged candlesticks of a larger timeframe at a smaller one. Smoothing transformation is applied to all elements of a price candlestick in this indicator: o...
The Three-Pole Super Smoother Filter is used in this indicator for moving average calculation.Indicator DescriptionThe Three-Pole Super Smoother Filter is utilized to calculate mov...
This indicator displays the direction of price acceleration from a larger timeframe to a smaller one.Indicator DescriptionThe indicator provides alerts about the current speed dire...
Indicator DescriptionThis indicator combines the Zig Zag indicator with Parabolic SAR, Fibonacci retracement levels, and a channel, providing a comprehensive tool for technical ana...
This indicator utilizes a two-pole super smoother filter for moving average calculation.Indicator DescriptionThe two-pole super smoother filter is used in this indicator to provide...
This indicator displays the direction of price acceleration from a larger timeframe to a smaller one.Indicator DescriptionThe indicator provides alerts about the current direction ...
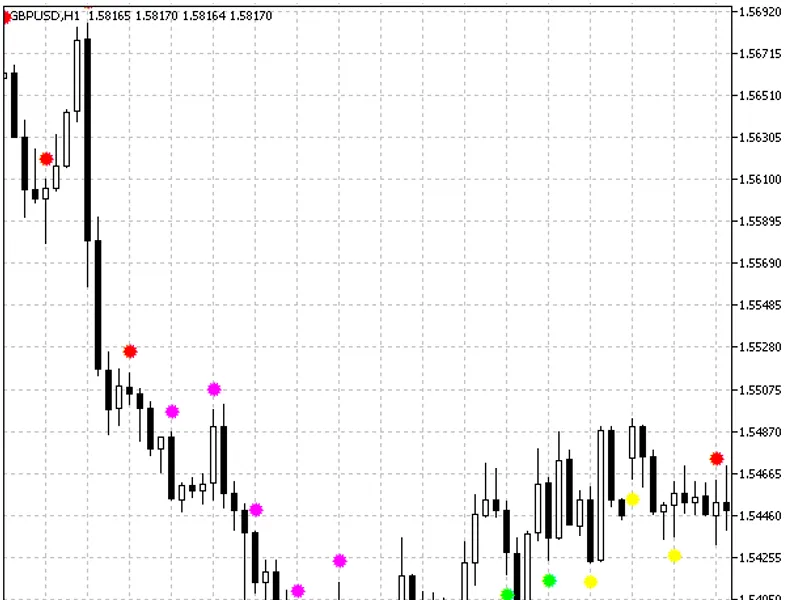
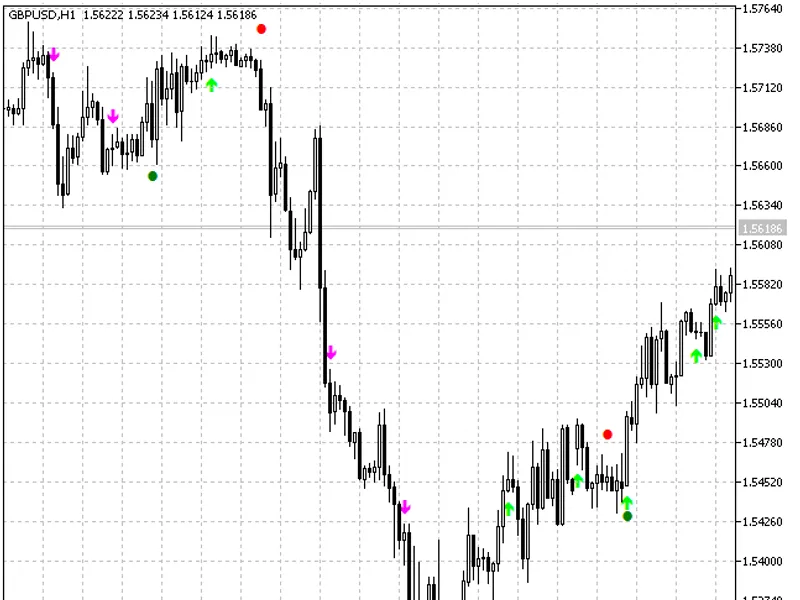
This indicator provides alerts and signals for making deals using large colored dots and arrows on a chart.The indicator is based on comparing the signals of oscillator and XMA mov...
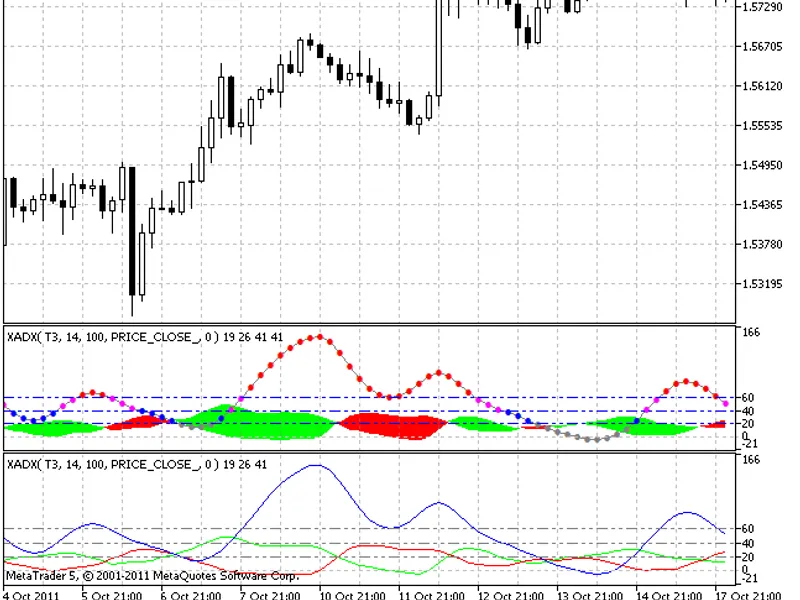
In order to determine a trend stability J. Welles Wilder developed the Average Directional Index (ADX). ADX allows to analyze market trends and make trading decisions, including Fo...
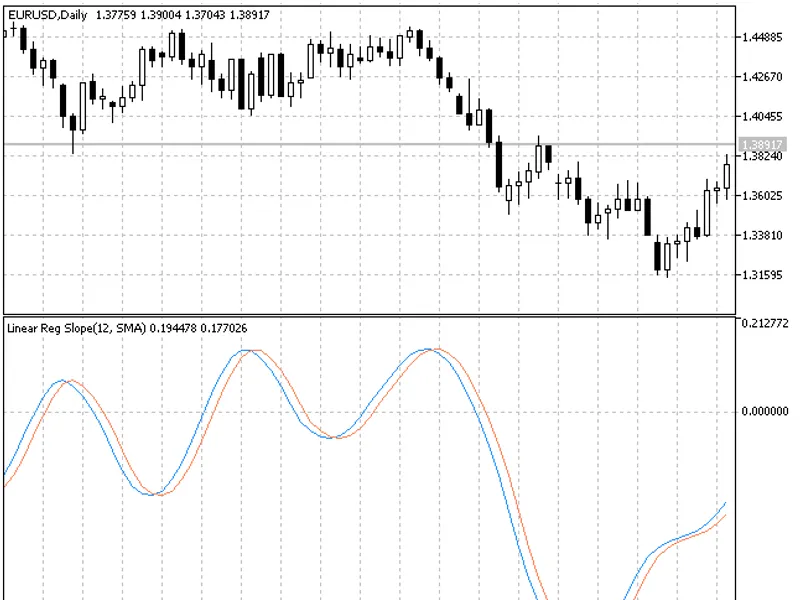
Linear Regression Slope IndicatorThis indicator displays the slope of the linear regression line.Features:- Simple Moving Average- Exponential Moving Average- Smoothed Moving Avera...
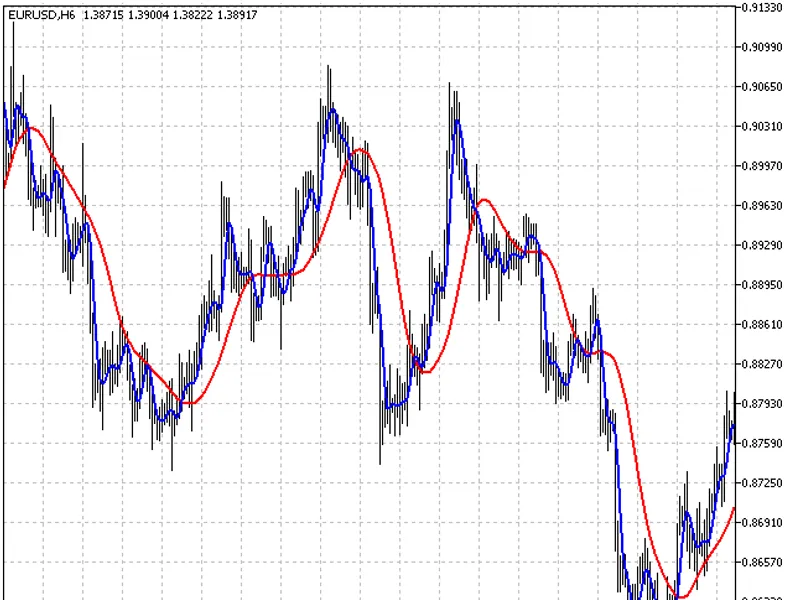
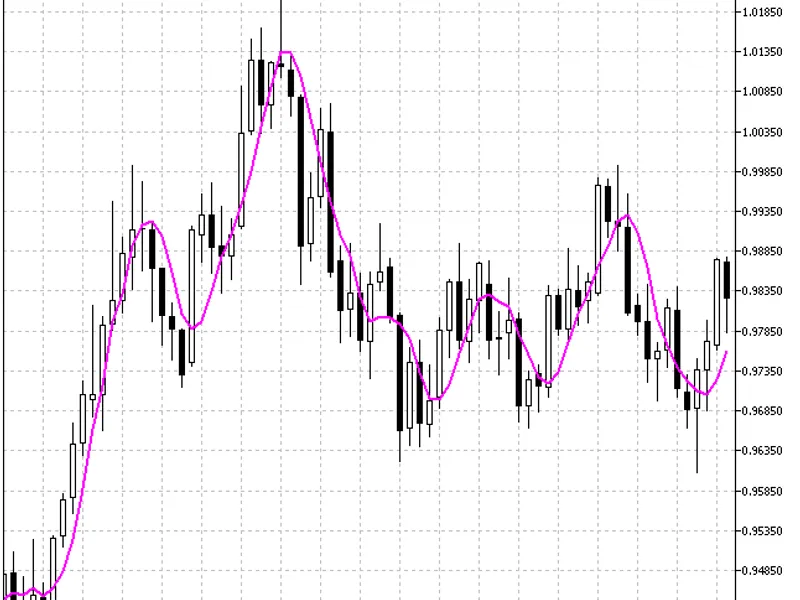
The Laguerre Filter indicator consists of two moving averages. The red moving average serves as a filter and a medium-term trend indicator. The blue moving average is used as a fas...
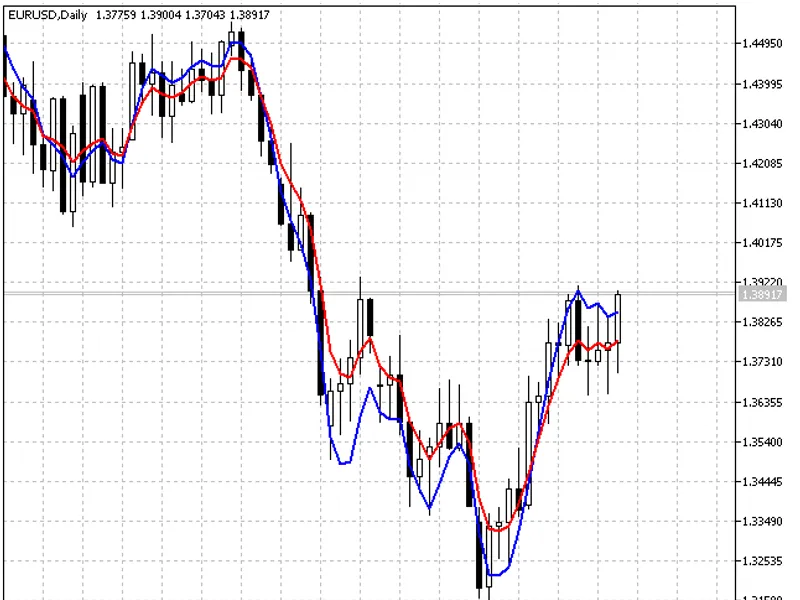
This indicator consists of two moving averages displayed on a single chart: a leading moving average and its EMA smoothing.These were introduced by John Ehlers.The moments when the...
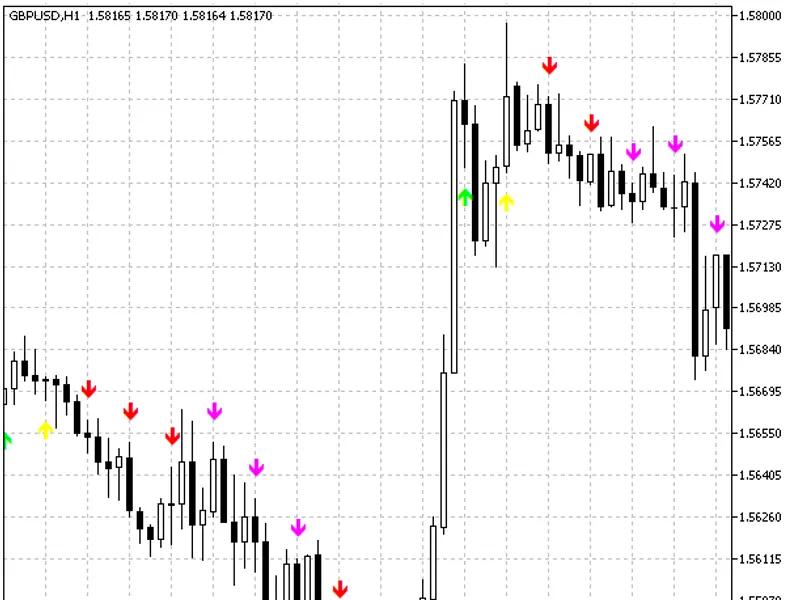
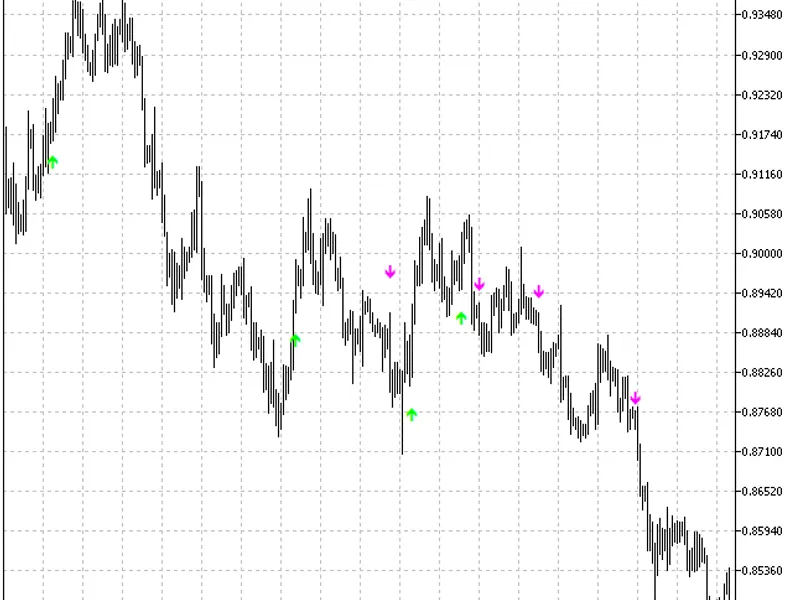
WPRSI Signal IndicatorThis indicator provides trading signals using colored arrows displayed directly on the chart.The signals are derived from the Williams Percent Range (WPR) and...
Unnormalized oscillator based on the linear regression algorithm.Supported smoothing methods:- Simple Moving Average- Exponential Moving Average- Smoothed Moving Average- Linear We...
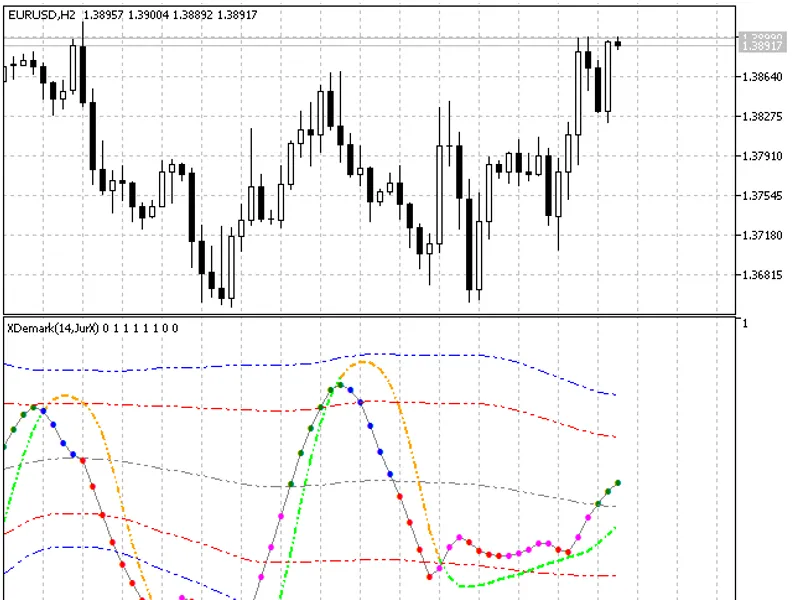
The XDE Marker BB indicator tracks areas of price exhaustion, which often correspond to price tops and bottoms.The indicator displays colored dots on the DeMarker line, with their ...
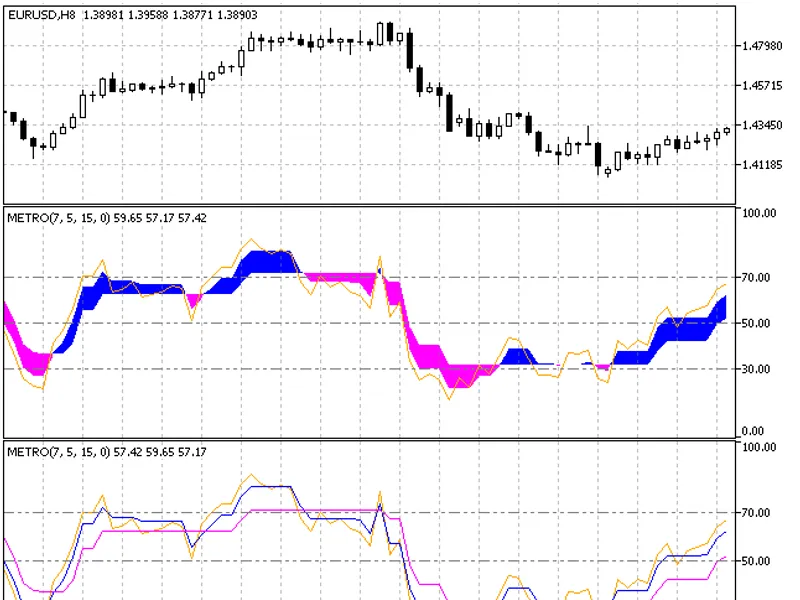
This oscillator displays its values considering the RSI technical indicator. The RSI indicator is displayed in orange, cloud color changes depending on the trend direction. Blue co...
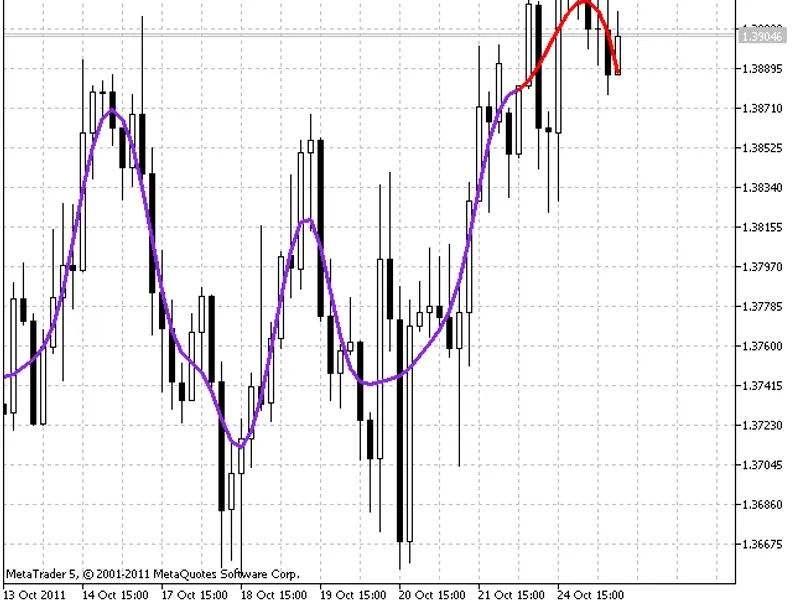
AFIRMA (Autoregressive Finite Impulse Response Moving Average) utilizes a digital filter to accurately represent price movement, albeit with a slight time lag.Traditional smoothing...
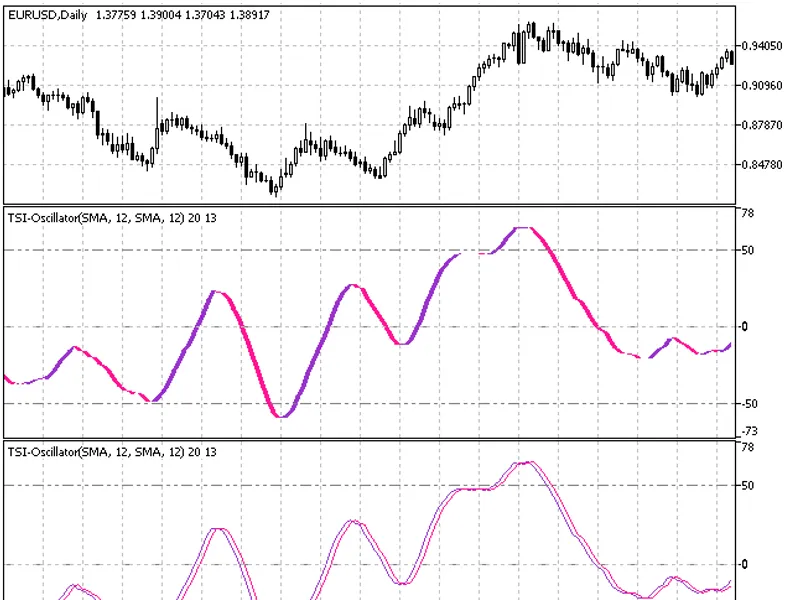
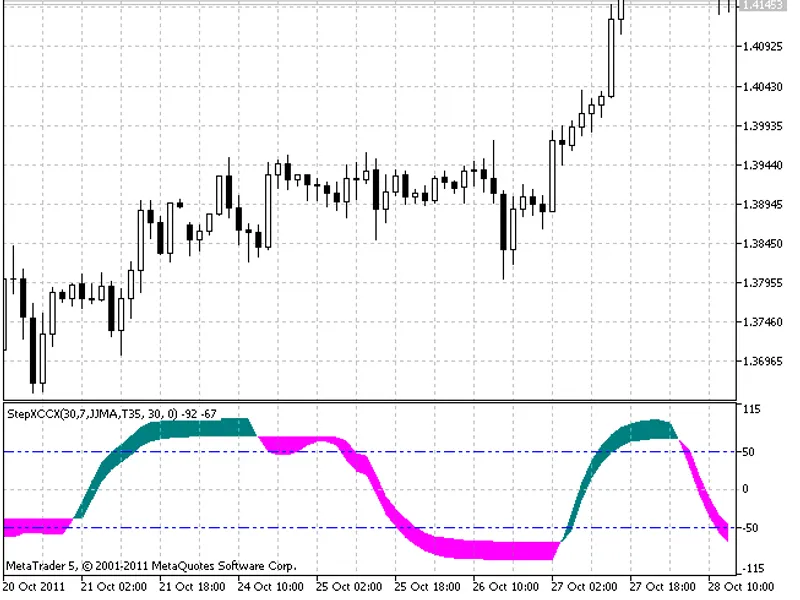
TSI Oscillator - A Normalized Oscillator with Signal LineThe TSI Oscillator is a technical indicator that typically ranges from -100 to +100 and includes a signal line for trend co...
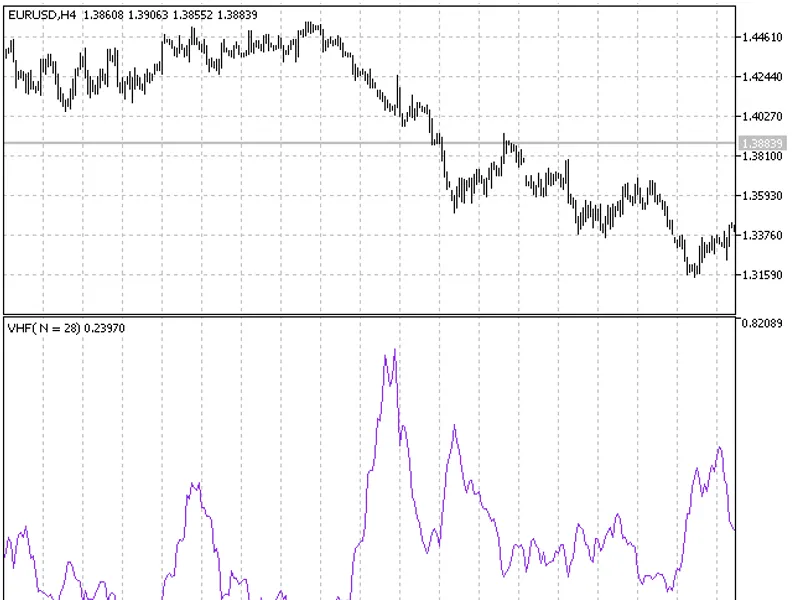
Vertical Horizontal Filter (VHF) indicates whether the market is trending or trading within a range.VHF was first described by Adam White in 2026.There are three primary interpreta...
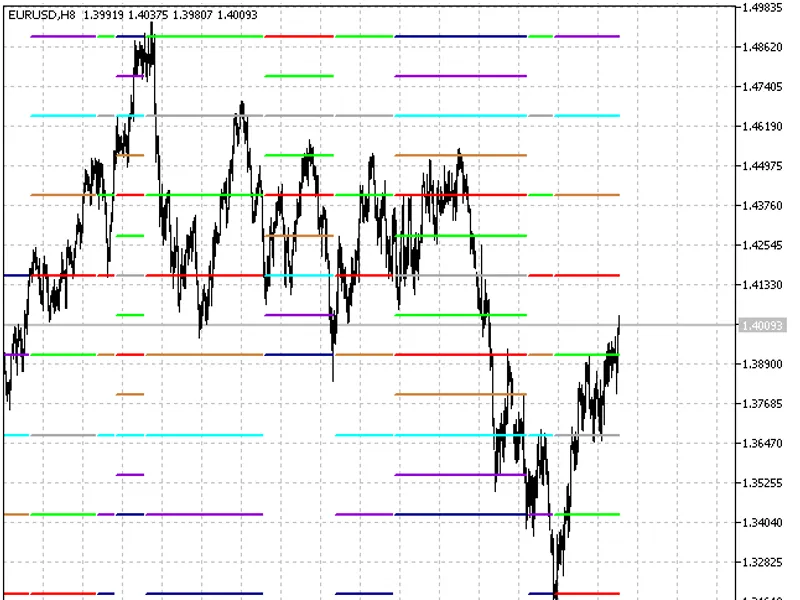
A key advantage of this indicator is the ability to set a fixed chart period for Murrey lines calculation using the timeframe input variable.This allows you to work with a specific...
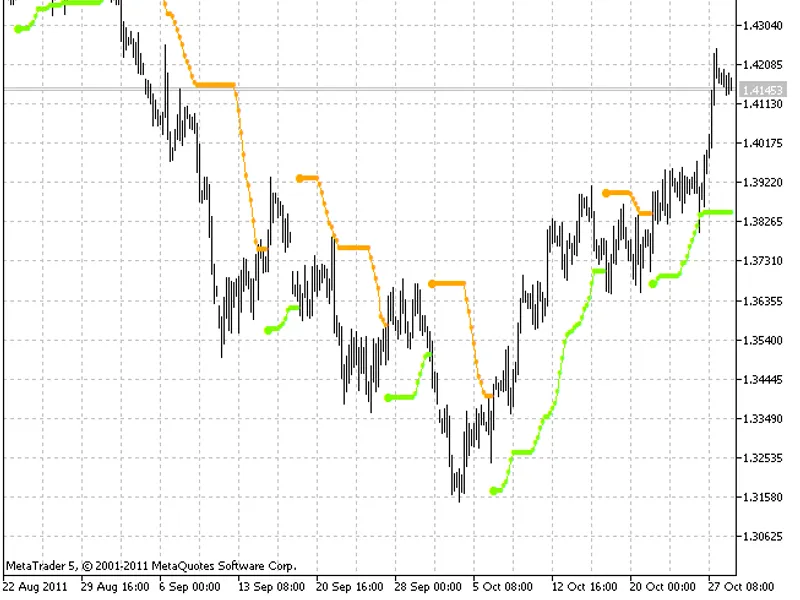
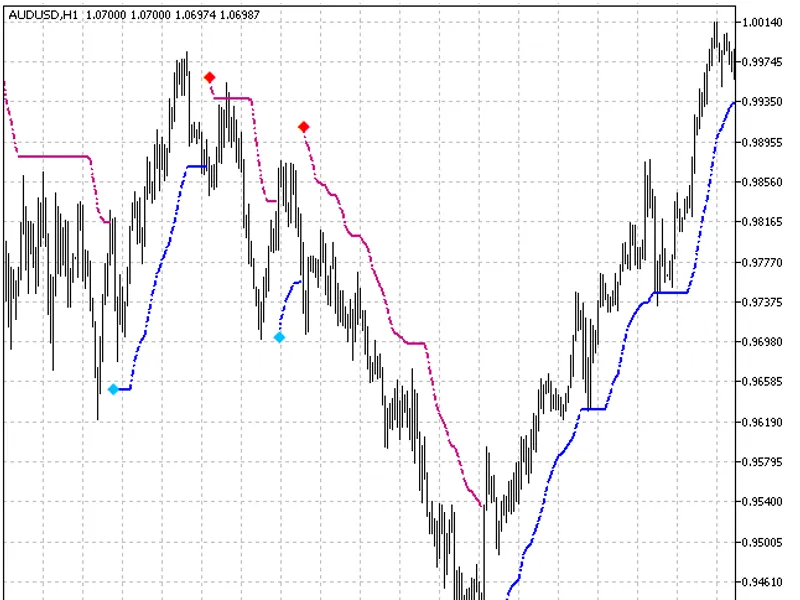
Bollinger Bands Stop Indicator is a trend detection tool that can also be used for setting stop orders. It is designed to be descriptive and user-friendly.Indicator Usage Tips:The ...
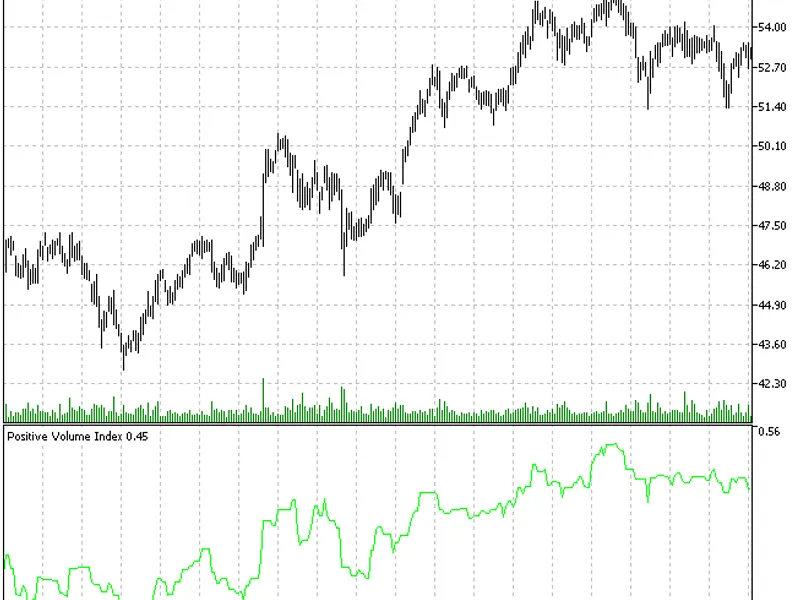
The Positive Volume Index (PVI) establishes a relationship between the increase in trading volume and changes in the price of a financial instrument. Specifically, if the trading v...
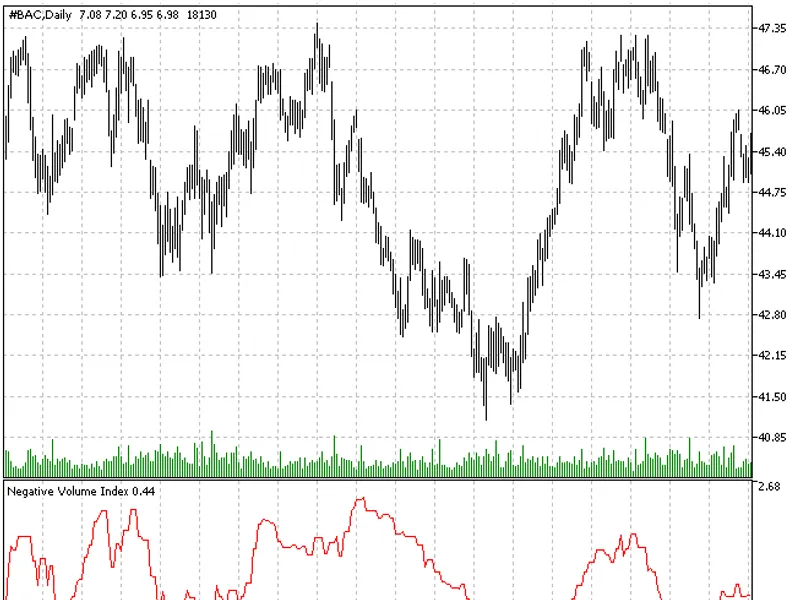
The Negative Volume Index (NVI) establishes a relationship between changes in an instrument's price and decreases in volume.When daily trading volume is lower than the previous day...
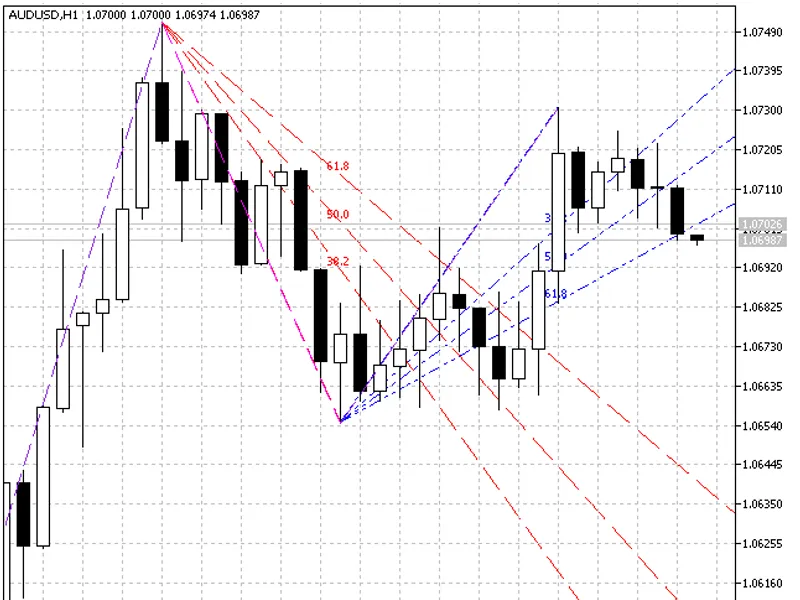
Indicator that allows building on the last two zigzags.Zig Zag with Fibonacci FanThis indicator analyzes the last two completed zigzags on your chart, providing a foundation for ap...
Trend Value Indicator
This indicator is designed to identify market trends and provide signals for trading. It offers flexibility for various applications, such as generating exit...
This is a symmetrical normalized oscillator inspired by ideas from a website.The color of the oscillator depends on the current trend direction. To filter the signals, it is recomm...
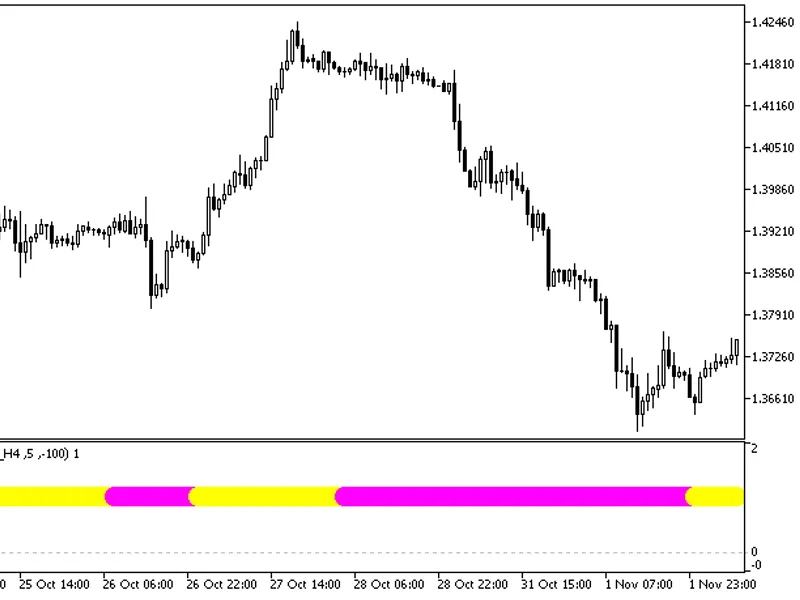
The JFATL indicator represents a hybrid of digital and analog filters, designed to display larger timeframe values on a smaller timeframe. The indicator is calculated using the fol...
The JFATL HT indicator is a hybrid of digital and analog filters that displays larger timeframe values at a smaller one in a completely minimized way and is located in a separate c...
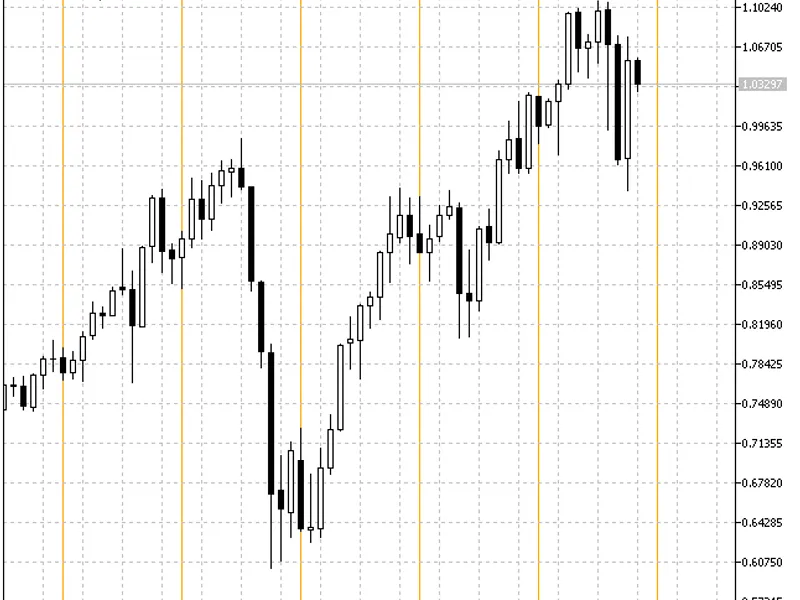
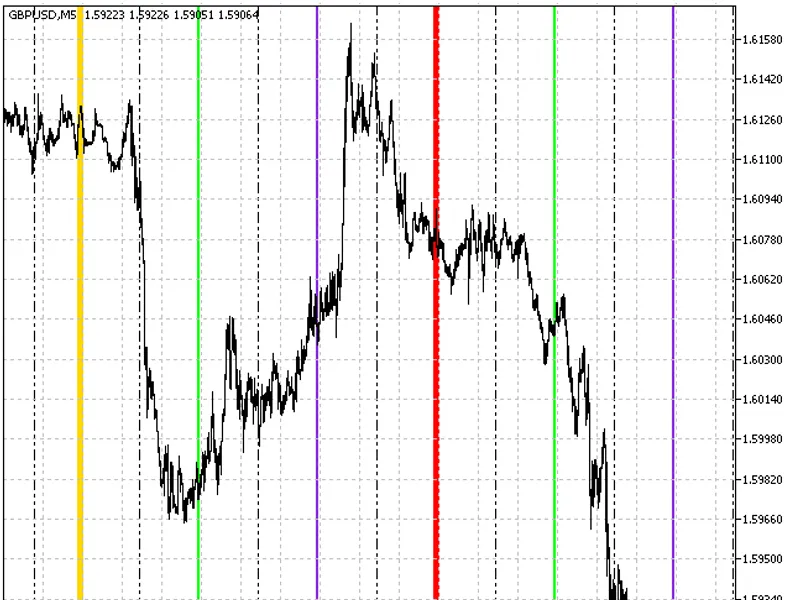
The indicator builds a vertical time grid with one month step on a chart.Indicator input parameters:- The indicator has input parameters that allow for customization.Key Features- ...
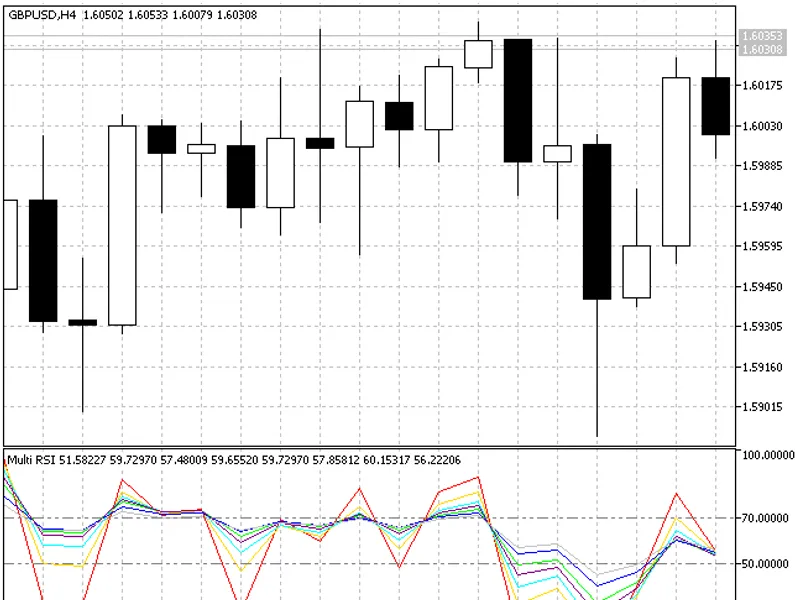
Eight RSI technical indicators with various input parameter values are displayed in one window.This indicator was first implemented in MQL4 and published on MQL5.com in 2026....
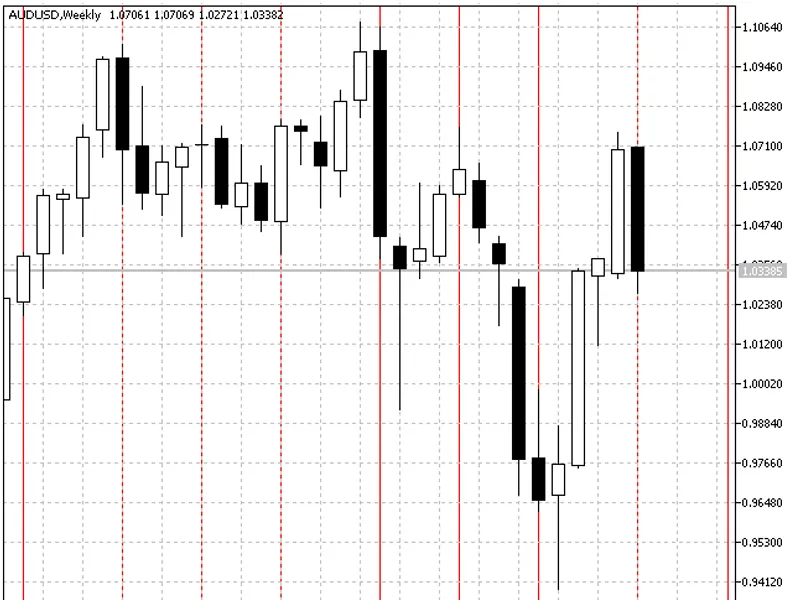
The indicator creates a vertical time grid with a one week step on a chart.Indicator Input Parameters:- The indicator is designed to provide a clear visual representation of time i...
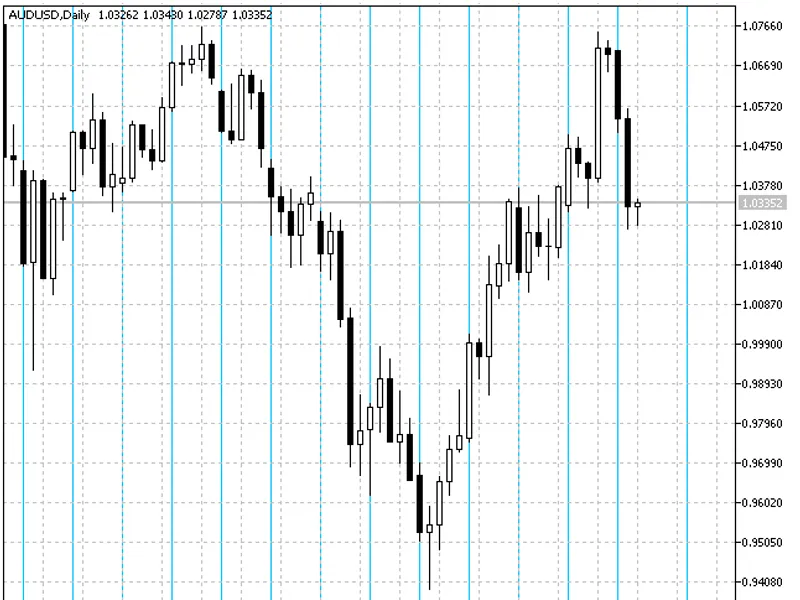
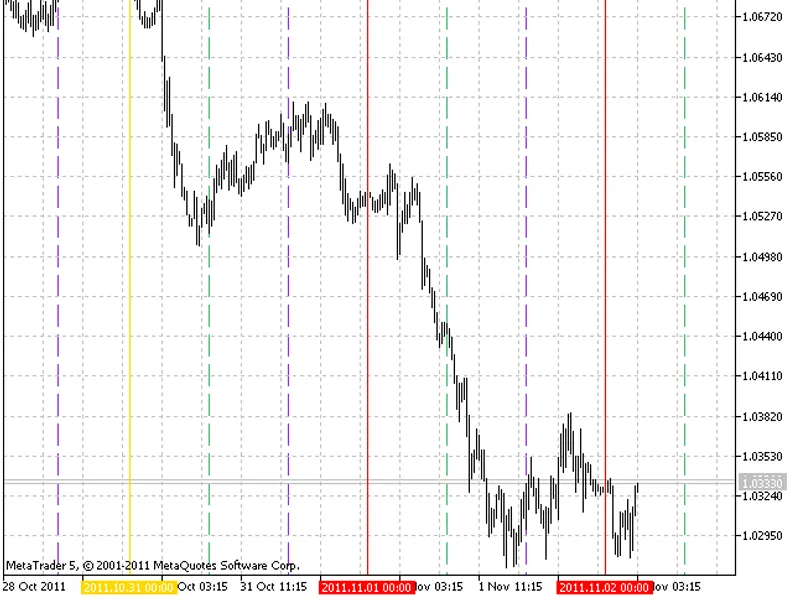
The indicator displays the vertical time grid with one day step on a chart.Indicator input parameters:- The indicator is designed to provide a clear visual representation of time i...
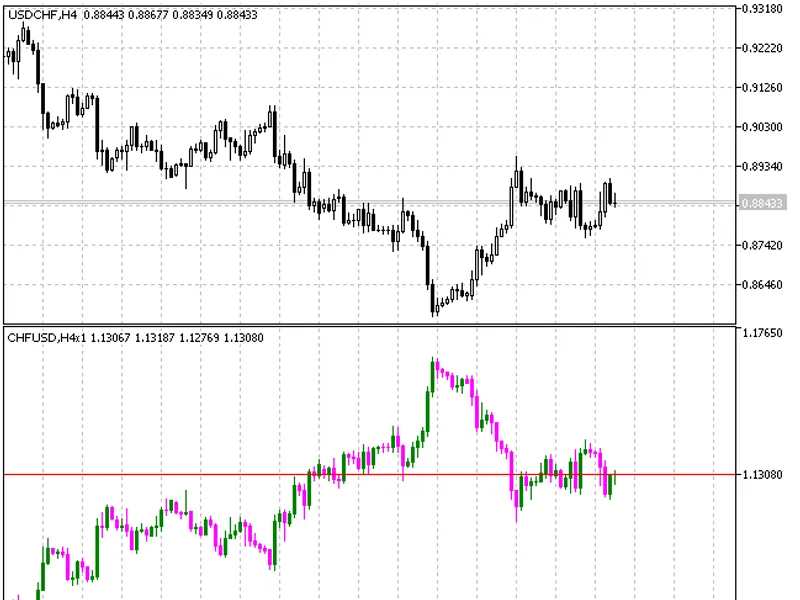
This indicator allows users to work with changing values in real time and mirror reversed (1/x) trading instruments.Key Features- Technical and custom indicators can be applied to ...
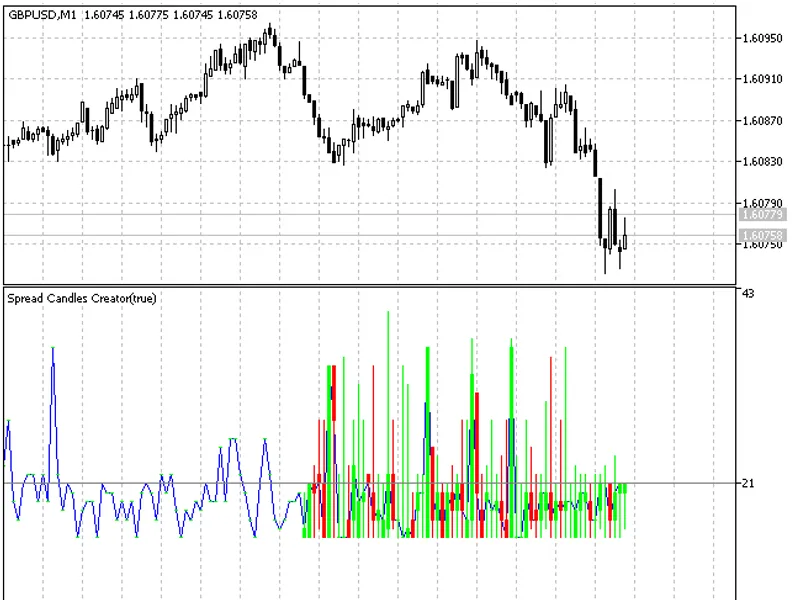
This indicator builds a candlestick chart consisting of floating spread current values in online mode.OverviewThe main objective of this tool is to observe a definite broker spread...
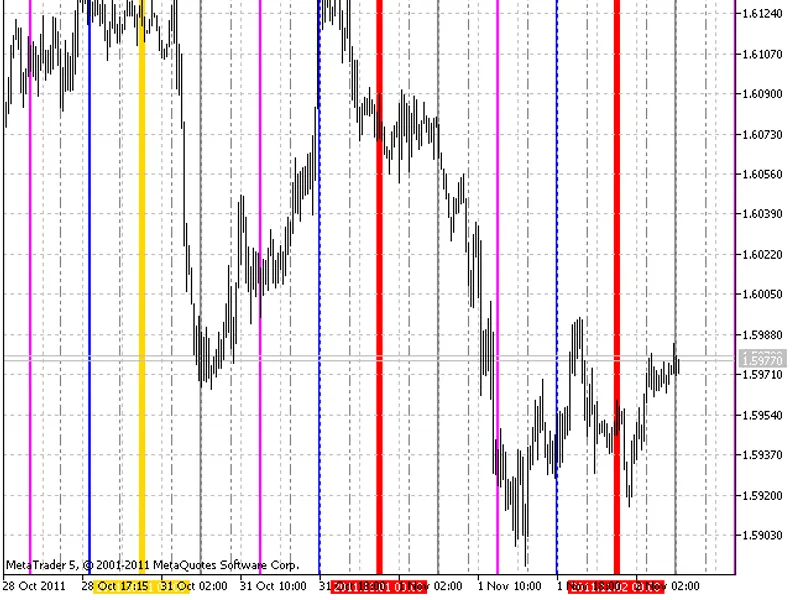
The indicator displays a vertical time grid with a four-hour step on a chart with an intraday timeframe not exceeding H4. The indicator is also not displayed on H3.Indicator Input ...
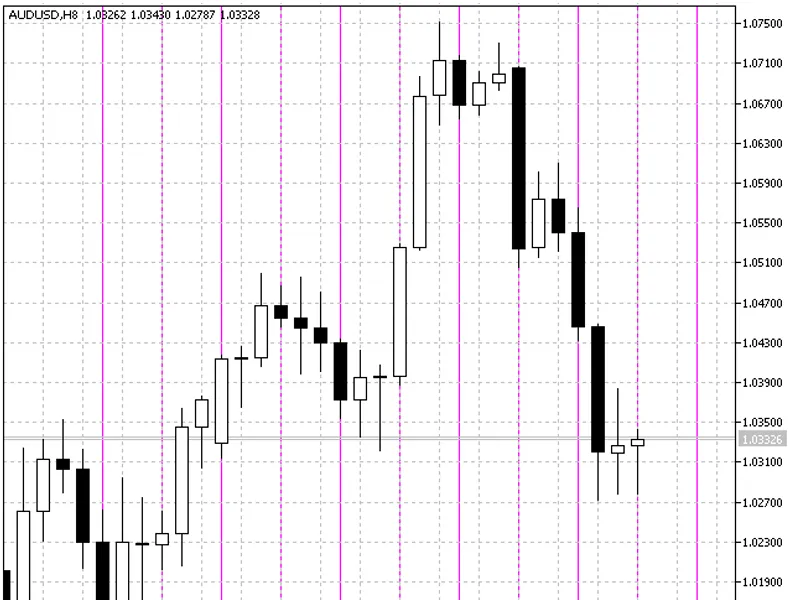
This indicator displays a vertical time grid on intraday charts with a step of eight hours.The indicator is specifically designed for intraday timeframes and will not be displayed ...
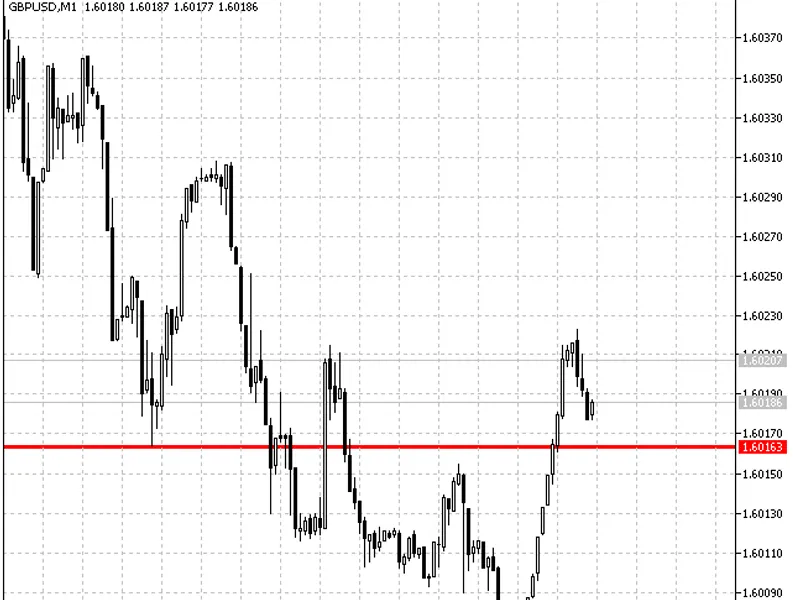
This indicator displays a horizontal line that represents the signal actuation level.Upon the initial launch of the indicator, the actuation level line appears gray and inactive. O...
This indicator displays a vertical time grid with a three-hour step on charts utilizing intraday timeframes up to H3.The indicator is not displayed on H2 timeframes.Indicator Input...
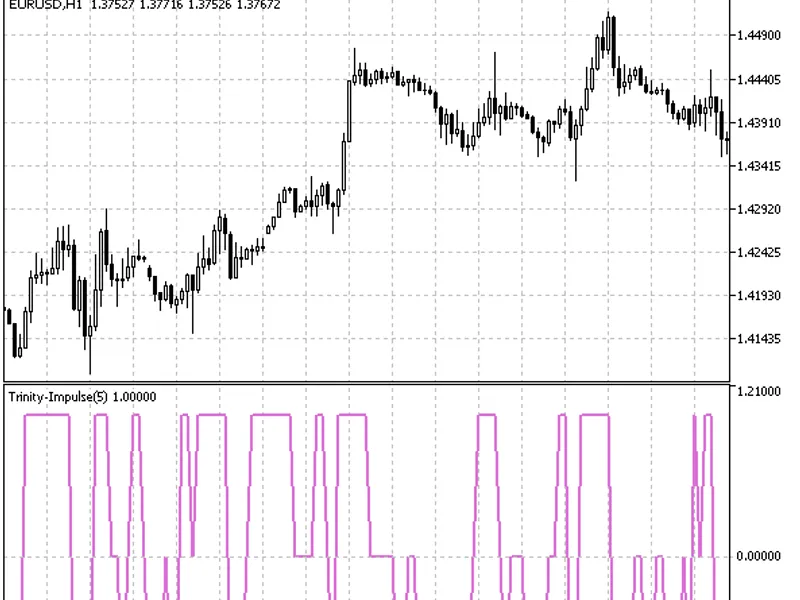
The Trinity Impulse indicator identifies market entry points and periods of consolidation (flat markets).A zero state indicates a flat market.A V-shaped impulse suggests entering t...
The indicator displays the crossing points of RSI indicators of various periods. A total of eight RSI indicators are used (two indicators per one crossing). The indicator signals s...
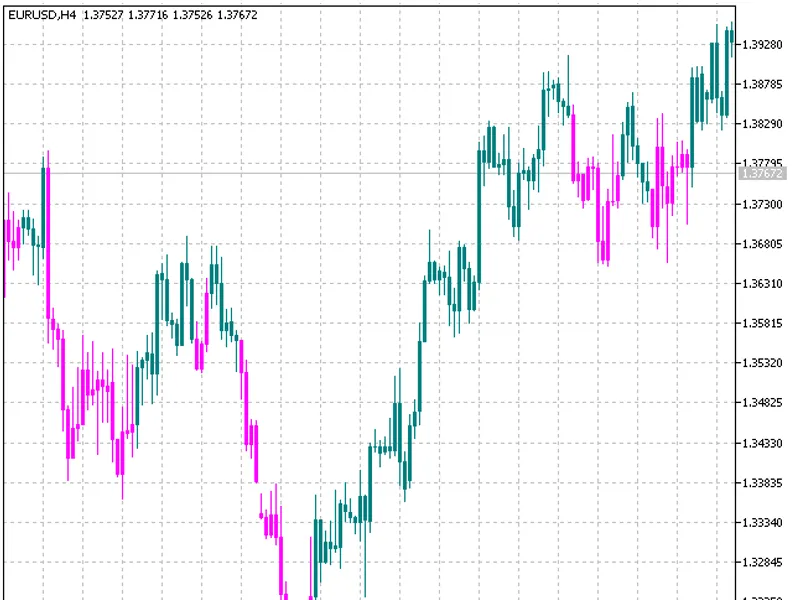
The indicator displays colored candlesticks based on the current trend, incorporating Fibonacci retracement levels. It also provides alerts or audio notifications for trend changes...